ThredUp (NASDAQ:TDUP) adds US$43m to market cap in the past 7 days, though investors from a year ago are still down 72%
It is a pleasure to report that the ThredUp Inc. (NASDAQ:TDUP) is up 95% in the last quarter. But that hardly compensates for the shocking decline over the last twelve months. Indeed, the share price is down a whopping 72% in the last year. It's not uncommon to see a bounce after a drop like that. The important thing is whether the company can turn it around, longer term.
On a more encouraging note the company has added US$43m to its market cap in just the last 7 days, so let's see if we can determine what's driven the one-year loss for shareholders.
See our latest analysis for ThredUp
Given that ThredUp didn't make a profit in the last twelve months, we'll focus on revenue growth to form a quick view of its business development. Shareholders of unprofitable companies usually expect strong revenue growth. As you can imagine, fast revenue growth, when maintained, often leads to fast profit growth.
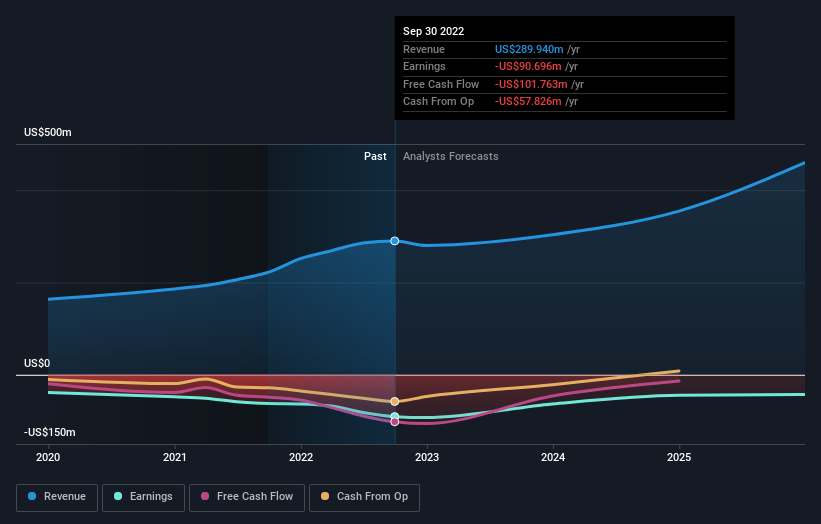
In the last twelve months, ThredUp increased its revenue by 30%. We think that is pretty nice growth. Unfortunately, the market wanted something better, given it sent the share price 72% lower during the year. One fear might be that the company might be losing too much money and will need to raise more. It seems that the market has concerns about the future, because that share price action does not seem to reflect the revenue growth at all.
The company's revenue and earnings (over time) are depicted in the image below (click to see the exact numbers).
We're pleased to report that the CEO is remunerated more modestly than most CEOs at similarly capitalized companies. But while CEO remuneration is always worth checking, the really important question is whether the company can grow earnings going forward. This free report showing analyst forecasts should help you form a view on ThredUp
A Different Perspective
ThredUp shareholders are down 72% for the year, even worse than the market loss of 8.1%. That's disappointing, but it's worth keeping in mind that the market-wide selling wouldn't have helped. Putting aside the last twelve months, it's good to see the share price has rebounded by 95%, in the last ninety days. Let's just hope this isn't the widely-feared 'dead cat bounce' (which would indicate further declines to come). I find it very interesting to look at share price over the long term as a proxy for business performance. But to truly gain insight, we need to consider other information, too. Even so, be aware that ThredUp is showing 3 warning signs in our investment analysis , and 1 of those is a bit unpleasant...
Of course ThredUp may not be the best stock to buy. So you may wish to see this free collection of growth stocks.
Please note, the market returns quoted in this article reflect the market weighted average returns of stocks that currently trade on US exchanges.
Have feedback on this article? Concerned about the content? Get in touch with us directly. Alternatively, email editorial-team (at) simplywallst.com.
This article by Simply Wall St is general in nature. We provide commentary based on historical data and analyst forecasts only using an unbiased methodology and our articles are not intended to be financial advice. It does not constitute a recommendation to buy or sell any stock, and does not take account of your objectives, or your financial situation. We aim to bring you long-term focused analysis driven by fundamental data. Note that our analysis may not factor in the latest price-sensitive company announcements or qualitative material. Simply Wall St has no position in any stocks mentioned.
Join A Paid User Research Session
You’ll receive a US$30 Amazon Gift card for 1 hour of your time while helping us build better investing tools for the individual investors like yourself. Sign up here
