ThredUp (NASDAQ:TDUP) Posts Better-Than-Expected Sales In Q4 But Stock Drops

Online fashion resale marketplace ThredUp (NASDAQ:TDUP) announced better-than-expected results in Q4 FY2023, with revenue up 14.1% year on year to $81.39 million. The company expects next quarter's revenue to be around $80 million, in line with analysts' estimates. It made a GAAP loss of $0.14 per share, improving from its loss of $0.19 per share in the same quarter last year.
Is now the time to buy ThredUp? Find out by accessing our full research report, it's free.
ThredUp (TDUP) Q4 FY2023 Highlights:
Revenue: $81.39 million vs analyst estimates of $80.33 million (1.3% beat)
EPS: -$0.14 vs analyst expectations of -$0.13 (7.7% miss)
Revenue Guidance for Q1 2024 is $80 million at the midpoint, roughly in line with what analysts were expecting
Management's revenue guidance for the upcoming financial year 2024 is $345 million at the midpoint, in line with analyst expectations and implying 7.1% growth (vs 11.9% in FY2023)
Free Cash Flow was -$10.18 million compared to -$1.26 million in the previous quarter
Gross Margin (GAAP): 61.9%, down from 63.1% in the same quarter last year
Active Buyers: 1.8 million
Market Capitalization: $226.3 million
“We closed out 2023 with another quarter of strong financial performance, demonstrating healthy top-line growth and bottom-line leverage,” said ThredUp CEO and Co-Founder James Reinhart.
Founded to revolutionize thrifting, ThredUp (NASDAQ:TDUP) is a leading online fashion resale marketplace that offers a wide selection of gently-used clothing and accessories.
Apparel, Accessories and Luxury Goods
Within apparel and accessories, not only do styles change more frequently today than decades past as fads travel through social media and the internet but consumers are also shifting the way they buy their goods, favoring omnichannel and e-commerce experiences. Some apparel, accessories, and luxury goods companies have made concerted efforts to adapt while those who are slower to move may fall behind.
Sales Growth
Examining a company's long-term performance can provide clues about its business quality. Any business can put up a good quarter or two, but the best consistently grow over the long haul. ThredUp's annualized revenue growth rate of 18.4% over the last four years was impressive for a consumer discretionary business.
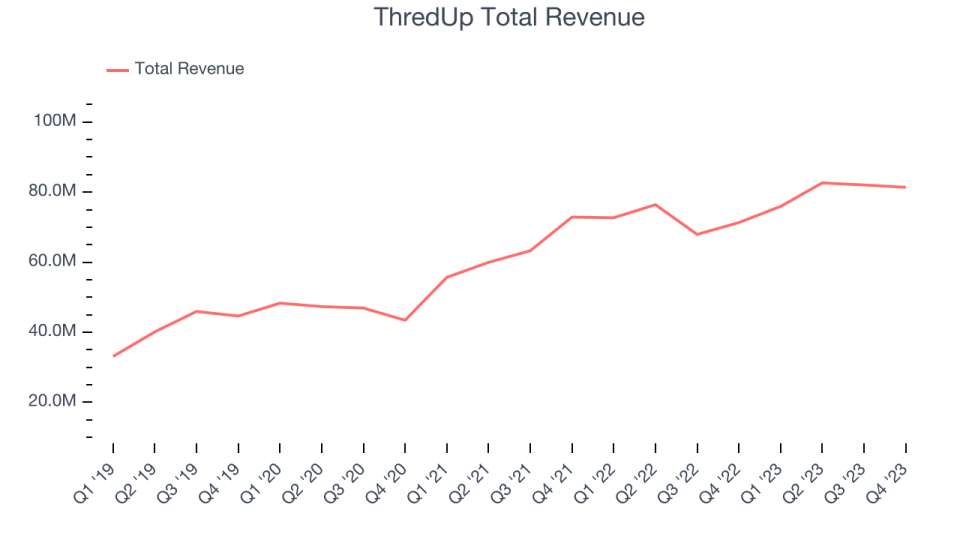
Within consumer discretionary, a long-term historical view may miss a company riding a successful new product or emerging trend. That's why we also follow short-term performance. ThredUp's recent history shows its momentum has slowed as its annualized revenue growth of 13.1% over the last two years is below its four-year trend.
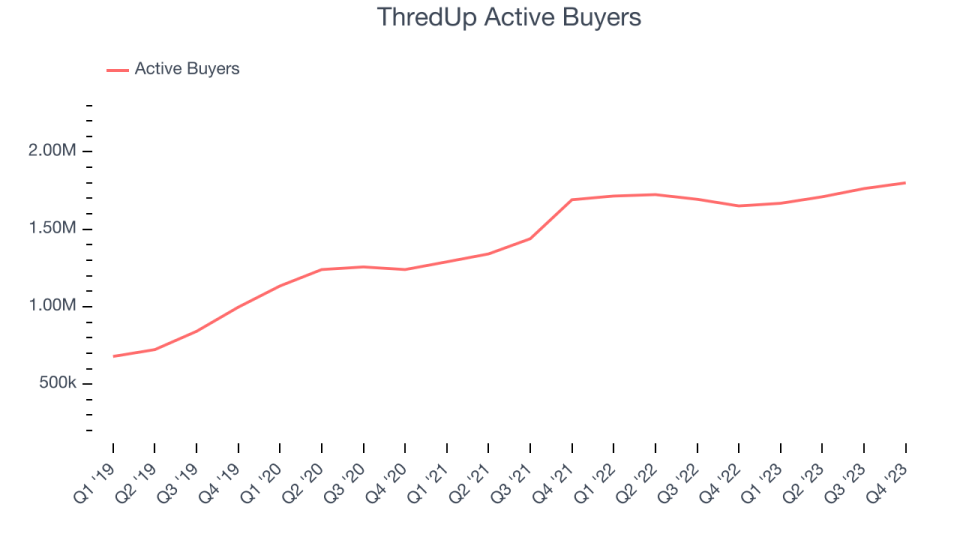
We can better understand the company's revenue dynamics by analyzing its number of active buyers, which reached 1.8 million in the latest quarter. Over the last two years, ThredUp's active buyers averaged 10.8% year-on-year growth. Because this number is lower than its revenue growth during the same period, we can see the company's monetization has risen.
This quarter, ThredUp reported robust year-on-year revenue growth of 14.1%, and its $81.39 million of revenue exceeded Wall Street's estimates by 1.3%. The company is guiding for revenue to rise 5.4% year on year to $80 million next quarter, improving from the 4.4% year-on-year increase it recorded in the same quarter last year. Looking ahead, Wall Street expects sales to grow 7.6% over the next 12 months, a deceleration from this quarter.
Here at StockStory, we certainly understand the potential of thematic investing. Diverse winners from Microsoft (MSFT) to Alphabet (GOOG), Coca-Cola (KO) to Monster Beverage (MNST) could all have been identified as promising growth stories with a megatrend driving the growth. So, in that spirit, we’ve identified a relatively under-the-radar profitable growth stock benefitting from the rise of AI, available to you FREE via this link.
Cash Is King
If you've followed StockStory for a while, you know we emphasize free cash flow. Why, you ask? We believe that in the end, cash is king, and you can't use accounting profits to pay the bills.
Over the last two years, ThredUp's demanding reinvestments to stay relevant with consumers have drained company resources. Its free cash flow margin has been among the worst in the consumer discretionary sector, averaging negative 21.9%.
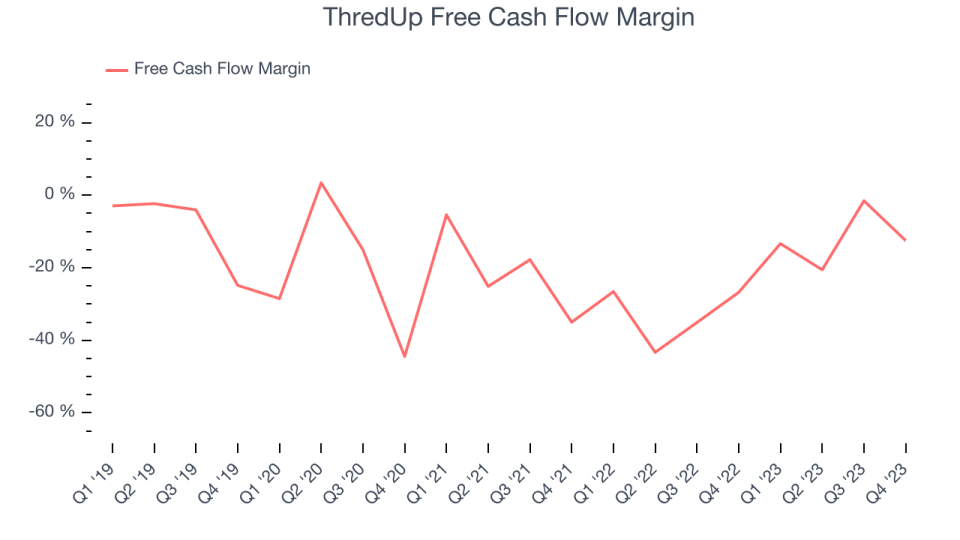
ThredUp burned through $10.18 million of cash in Q4, equivalent to a negative 12.5% margin, increasing its cash burn by 46.7% year on year. Over the next year, analysts predict ThredUp will continue burning cash, albeit to a lesser extent. Their consensus estimates imply its LTM free cash flow margin of negative 12% will increase to negative 2.3%.
Key Takeaways from ThredUp's Q4 Results
It was encouraging to see ThredUp provide full-year revenue guidance that slightly topped analysts' expectations. We were also happy its revenue narrowly outperformed Wall Street's estimates. On the other hand, its operating margin, EPS, and active buyers fell short of Wall Street's estimates. This isn't great as the company is unprofitable, and its number of active buyers is a proxy for the health of its platform. Overall, the results could have been better. The company is down 8.5% on the results and currently trades at $2.15 per share.
ThredUp may have had a tough quarter, but does that actually create an opportunity to invest right now? When making that decision, it's important to consider its valuation, business qualities, as well as what has happened in the latest quarter. We cover that in our actionable full research report which you can read here, it's free.
