Three Understated Metrics For Arrow Financial Corporation (NASDAQ:AROW) You Should Know

As a small-cap bank stock with a market capitalisation of US$495m, Arrow Financial Corporation’s (NASDAQ:AROW) risk and profitability are largely determined by the underlying economic growth of the US regions in which it operates. A bank’s cash flow is directly impacted by economic growth as it is the main driver of deposit levels and demand for loans which it profits from. Post-GFC recovery brought about a new set of reforms, Basel III, which was created to improve regulation, supervision and risk management in the financial services industry. Basel III target banking regulations to improve the sector’s ability to absorb shocks resulting from economic stress which may expose financial institutions like Arrow Financial to vulnerabilities. Unpredictable macro events such as political instability could weaken its financial position which is why it is important to understand how well the bank manages its risk levels. High liquidity and low leverage could position Arrow Financial favourably at the face of macro headwinds. A way to measure this risk is to look at three leverage and liquidity metrics which I will take you through today.
See our latest analysis for Arrow Financial
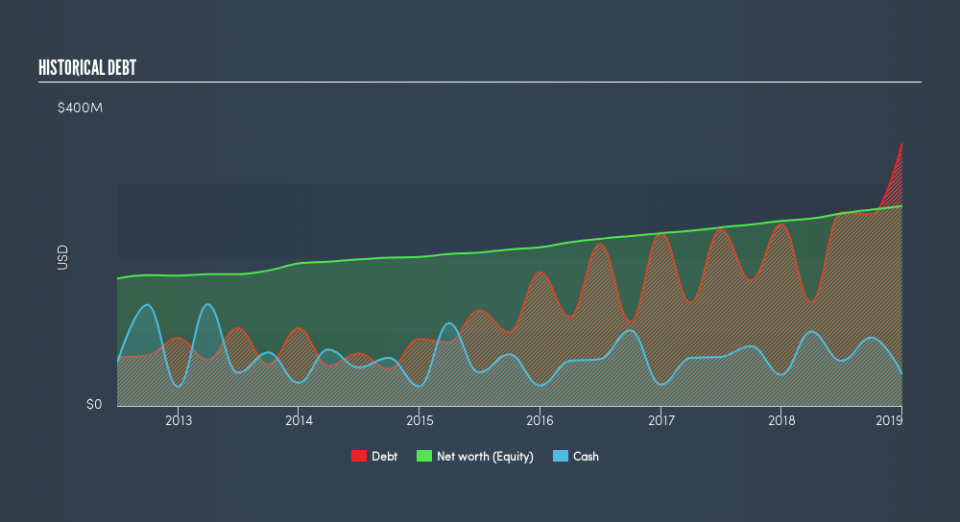
Why Does AROW's Leverage Matter?
Banks with low leverage are exposed to lower risks around their ability to repay debt. A bank’s leverage can be thought of as the amount of assets it holds compared to its own shareholders’ funds. Though banks are required to have a certain level of buffer to meet its capital requirements, Arrow Financial’s leverage level of less than the suitable maximum level of 20x, at 11.08x, is considered to be very cautious and prudent. This means the bank has a sensibly high level of equity compared to the level of debt it has taken on to maintain operations which places it in a strong position to pay back its debt in unforeseen circumstances. Should the bank need to increase its debt levels to meet capital requirements, it will have abundant headroom to do so.
How Should We Measure AROW's Liquidity?

As above-mentioned, loans are quite illiquid so it is important to understand how much of these loans make up Arrow Financial’s total assets. Normally, they should not exceed 70% of total assets, however its current level of 73% means the bank has lent out 2.82% above the sensible threshold. This means its revenue is reliant on these specific assets which means the bank is also more likely to be exposed to default compared to its competitors with less loans.
Does AROW Have Liquidity Mismatch?
A way banks make money is by lending out its deposits as loans. Loans are generally fixed term which means they cannot be readily realized, however, customer deposits are liabilities which must be repaid on-demand and in short notice. This mismatch between illiquid loans and liquid deposits poses a risk for the bank if unusual events occur and requires it to immediately repay its depositors. Since Arrow Financial’s loan to deposit ratio of 93% is higher than the appropriate level of 90%, this level puts the bank in a risky position as it borders negative liquidity disparity between loan and deposit levels. Essentially, for $1 of deposits with the bank, it lends out more than $0.9 which is risky.
Next Steps:
Keep in mind that a stock investment requires research on more than just its operational side. I've put together three pertinent aspects you should further research:
Valuation: What is AROW worth today? Has the future growth potential already been factored into the price? The intrinsic value infographic in our free research report helps visualize whether AROW is currently mispriced by the market.
Management Team: An experienced management team on the helm increases our confidence in the business – take a look at who sits on Arrow Financial’s board and the CEO’s back ground.
Other High-Performing Stocks: Are there other stocks that provide better prospects with proven track records? Explore our free list of these great stocks here.
We aim to bring you long-term focused research analysis driven by fundamental data. Note that our analysis may not factor in the latest price-sensitive company announcements or qualitative material.
If you spot an error that warrants correction, please contact the editor at editorial-team@simplywallst.com. This article by Simply Wall St is general in nature. It does not constitute a recommendation to buy or sell any stock, and does not take account of your objectives, or your financial situation. Simply Wall St has no position in the stocks mentioned. Thank you for reading.
