Three Understated Metrics For Wells Fargo & Company (NYSE:WFC) You Should Know

Wells Fargo & Company (NYSE:WFC) is a large-cap stock operating in the financial services sector with a market cap of US$276.74b. As major financial institutions return to health after the Global Financial Crisis, we are seeing an increase in market confidence, and understanding of, these “too-big-to-fail” banking stocks. After the crisis, a set of reforms called Basel III was created with the purpose of strengthening regulation, risk management and supervision in the banking sector. Basel III target banking regulations to improve the sector’s ability to absorb shocks resulting from economic stress which may expose financial institutions like banks to vulnerabilities. Operating in USD, WFC is held to strict regulation which focus investor attention to the type and level of risk it takes on. We should we cautious when it comes to investing in financial stocks due to the various risks large banks tend to face. Today we will analyse some bank-specific metrics and take a closer look at leverage and liquidity.
Check out our latest analysis for Wells Fargo
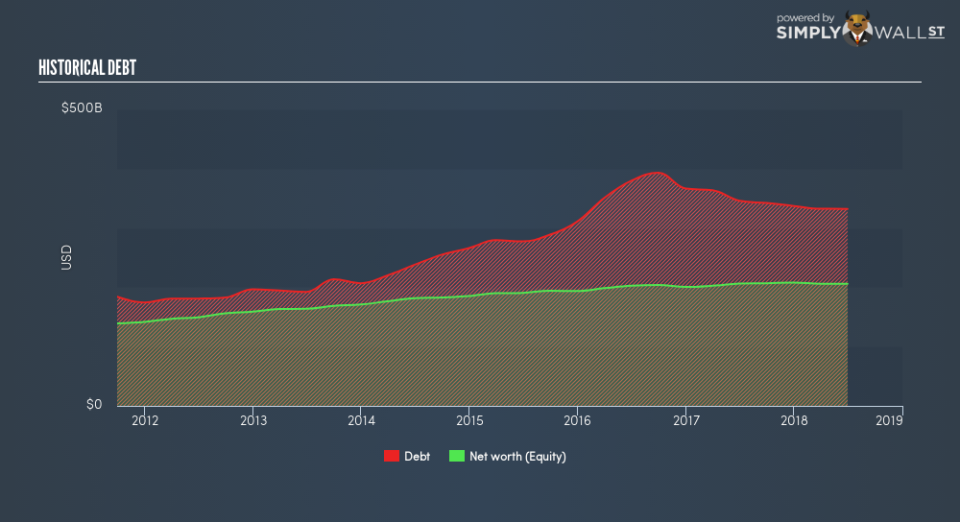
Why Does WFC’s Leverage Matter?
Banks with low leverage are better positioned to weather adverse headwinds as they have less debt to pay off. A bank’s leverage may be thought of as the level of assets it owns compared to its own shareholders’ equity. Financial institutions are required to have a certain level of buffer to meet capital adequacy levels. Wells Fargo’s leverage level of 9.12x is significantly below the appropriate ceiling of 20x. This means the bank exhibits very strong leverage management and is well-positioned to repay its debtors in the case of any adverse events since it has an appropriately high level of equity relative to the debt it has taken on to remain in business. Should the bank need to increase its debt levels to meet capital requirements, it will have abundant headroom to do so.
How Should We Measure WFC’s Liquidity?

As abovementioned, loans are quite illiquid so it is important to understand how much of these loans make up the bank’s total assets. Normally, they should not exceed 70% of total assets, which is consistent with Wells Fargo’s state given its much lower ratio of 49.7%. This means less than half of the bank’s total assets are tied up in the form of illiquid loans, leading to high liquidity, perhaps at the expense of generating interest income.
Does WFC Have Liquidity Mismatch?
WFC profits by lending out its customers’ deposits as loans and charge an interest on the principle. These loans tend to be fixed term which means they cannot be readily realized, conversely, on the liability side, customer deposits must be paid in very short notice and on-demand. This mismatch between illiquid loans and liquid deposits poses a risk for the bank if unusual events occur and requires it to immediately repay its depositors. Since Wells Fargo’s loan to deposit ratio of 73.6% is within the sensible margin, below than the appropriate maximum of 90%, this level positions the bank cautiously in terms of liquidity as it has not disproportionately lent out its deposits and has retained an apt level of deposits.
Next Steps:
Wells Fargo meets all of our liquidity and leverage criteria, exhibiting operational prudency. The operational risk side of a bank is an important fundamental often overlooked by investors. Its high liquidity and low leverage levels mean the bank is well-positioned to meet its financial obligations in the case of any adverse and unpredictable macro events. We’ve only touched on operational risks for WFC in this article. But as a stock investment, there are other fundamentals you need to understand. I’ve put together three important aspects you should further research:
Future Outlook: What are well-informed industry analysts predicting for WFC’s future growth? Take a look at our free research report of analyst consensus for WFC’s outlook.
Valuation: What is WFC worth today? Has the future growth potential already been factored into the price? The intrinsic value infographic in our free research report helps visualize whether WFC is currently mispriced by the market.
Other High-Performing Stocks: Are there other stocks that provide better prospects with proven track records? Explore our free list of these great stocks here.
To help readers see past the short term volatility of the financial market, we aim to bring you a long-term focused research analysis purely driven by fundamental data. Note that our analysis does not factor in the latest price-sensitive company announcements.
The author is an independent contributor and at the time of publication had no position in the stocks mentioned. For errors that warrant correction please contact the editor at editorial-team@simplywallst.com.
