Timbercreek Financial's (TSE:TF) investors will be pleased with their 7.1% return over the last five years
In order to justify the effort of selecting individual stocks, it's worth striving to beat the returns from a market index fund. But even the best stock picker will only win with some selections. At this point some shareholders may be questioning their investment in Timbercreek Financial Corp. (TSE:TF), since the last five years saw the share price fall 28%. The falls have accelerated recently, with the share price down 10% in the last three months.
Now let's have a look at the company's fundamentals, and see if the long term shareholder return has matched the performance of the underlying business.
See our latest analysis for Timbercreek Financial
To paraphrase Benjamin Graham: Over the short term the market is a voting machine, but over the long term it's a weighing machine. One imperfect but simple way to consider how the market perception of a company has shifted is to compare the change in the earnings per share (EPS) with the share price movement.
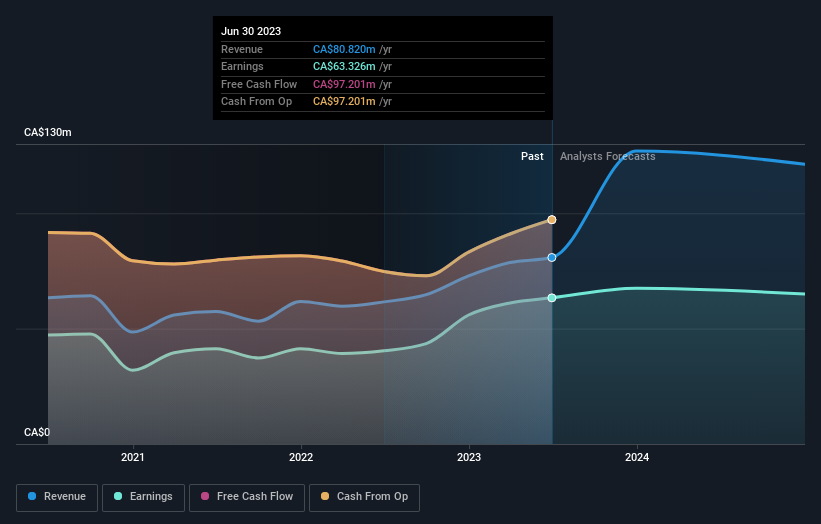
During the unfortunate half decade during which the share price slipped, Timbercreek Financial actually saw its earnings per share (EPS) improve by 2.9% per year. Given the share price reaction, one might suspect that EPS is not a good guide to the business performance during the period (perhaps due to a one-off loss or gain). Or possibly, the market was previously very optimistic, so the stock has disappointed, despite improving EPS.
Based on these numbers, we'd venture that the market may have been over-optimistic about forecast growth, half a decade ago. Looking to other metrics might better explain the share price change.
The steady dividend doesn't really explain why the share price is down. It's not immediately clear to us why the stock price is down but further research might provide some answers.
You can see below how earnings and revenue have changed over time (discover the exact values by clicking on the image).
We're pleased to report that the CEO is remunerated more modestly than most CEOs at similarly capitalized companies. It's always worth keeping an eye on CEO pay, but a more important question is whether the company will grow earnings throughout the years. This free report showing analyst forecasts should help you form a view on Timbercreek Financial
What About Dividends?
It is important to consider the total shareholder return, as well as the share price return, for any given stock. The TSR incorporates the value of any spin-offs or discounted capital raisings, along with any dividends, based on the assumption that the dividends are reinvested. It's fair to say that the TSR gives a more complete picture for stocks that pay a dividend. In the case of Timbercreek Financial, it has a TSR of 7.1% for the last 5 years. That exceeds its share price return that we previously mentioned. This is largely a result of its dividend payments!
A Different Perspective
Timbercreek Financial shareholders are down 3.3% for the year (even including dividends), but the market itself is up 4.9%. Even the share prices of good stocks drop sometimes, but we want to see improvements in the fundamental metrics of a business, before getting too interested. Longer term investors wouldn't be so upset, since they would have made 1.4%, each year, over five years. If the fundamental data continues to indicate long term sustainable growth, the current sell-off could be an opportunity worth considering. I find it very interesting to look at share price over the long term as a proxy for business performance. But to truly gain insight, we need to consider other information, too. Consider for instance, the ever-present spectre of investment risk. We've identified 2 warning signs with Timbercreek Financial (at least 1 which is potentially serious) , and understanding them should be part of your investment process.
If you would prefer to check out another company -- one with potentially superior financials -- then do not miss this free list of companies that have proven they can grow earnings.
Please note, the market returns quoted in this article reflect the market weighted average returns of stocks that currently trade on Canadian exchanges.
Have feedback on this article? Concerned about the content? Get in touch with us directly. Alternatively, email editorial-team (at) simplywallst.com.
This article by Simply Wall St is general in nature. We provide commentary based on historical data and analyst forecasts only using an unbiased methodology and our articles are not intended to be financial advice. It does not constitute a recommendation to buy or sell any stock, and does not take account of your objectives, or your financial situation. We aim to bring you long-term focused analysis driven by fundamental data. Note that our analysis may not factor in the latest price-sensitive company announcements or qualitative material. Simply Wall St has no position in any stocks mentioned.
