What Is TOTAL's (EPA:FP) P/E Ratio After Its Share Price Rocketed?

Those holding TOTAL (EPA:FP) shares must be pleased that the share price has rebounded 42% in the last thirty days. But unfortunately, the stock is still down by 36% over a quarter. But shareholders may not all be feeling jubilant, since the share price is still down 38% in the last year.
Assuming no other changes, a sharply higher share price makes a stock less attractive to potential buyers. In the long term, share prices tend to follow earnings per share, but in the short term prices bounce around in response to short term factors (which are not always obvious). The implication here is that deep value investors might steer clear when expectations of a company are too high. Perhaps the simplest way to get a read on investors' expectations of a business is to look at its Price to Earnings Ratio (PE Ratio). A high P/E implies that investors have high expectations of what a company can achieve compared to a company with a low P/E ratio.
See our latest analysis for TOTAL
How Does TOTAL's P/E Ratio Compare To Its Peers?
TOTAL has a P/E ratio of 7.79. As you can see below TOTAL has a P/E ratio that is fairly close for the average for the oil and gas industry, which is 8.3.
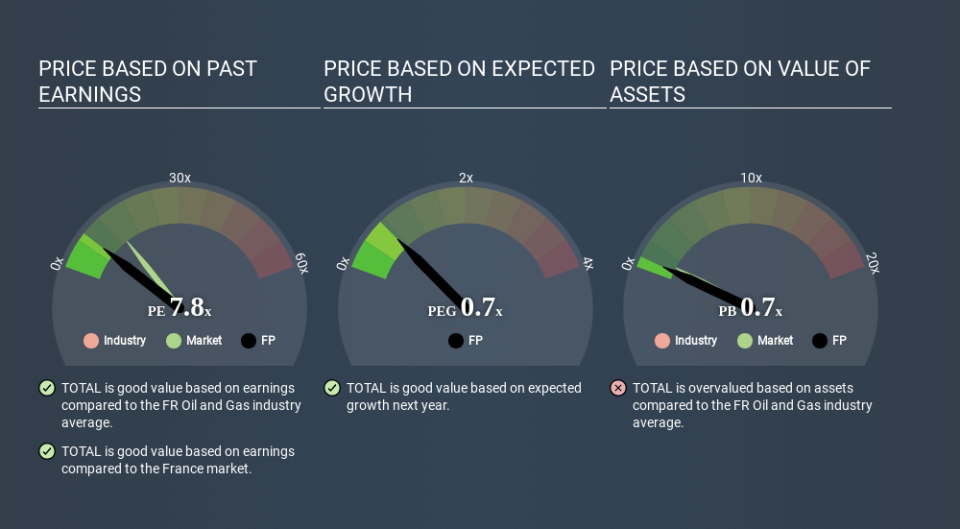
Its P/E ratio suggests that TOTAL shareholders think that in the future it will perform about the same as other companies in its industry classification. The company could surprise by performing better than average, in the future. I would further inform my view by checking insider buying and selling., among other things.
How Growth Rates Impact P/E Ratios
Probably the most important factor in determining what P/E a company trades on is the earnings growth. When earnings grow, the 'E' increases, over time. That means unless the share price increases, the P/E will reduce in a few years. So while a stock may look expensive based on past earnings, it could be cheap based on future earnings.
TOTAL shrunk earnings per share by 1.3% last year. But over the longer term (5 years) earnings per share have increased by 18%.
Remember: P/E Ratios Don't Consider The Balance Sheet
It's important to note that the P/E ratio considers the market capitalization, not the enterprise value. In other words, it does not consider any debt or cash that the company may have on the balance sheet. Hypothetically, a company could reduce its future P/E ratio by spending its cash (or taking on debt) to achieve higher earnings.
Such spending might be good or bad, overall, but the key point here is that you need to look at debt to understand the P/E ratio in context.
How Does TOTAL's Debt Impact Its P/E Ratio?
TOTAL's net debt equates to 28% of its market capitalization. You'd want to be aware of this fact, but it doesn't bother us.
The Bottom Line On TOTAL's P/E Ratio
TOTAL's P/E is 7.8 which is below average (14.0) in the FR market. With only modest debt, it's likely the lack of EPS growth at least partially explains the pessimism implied by the P/E ratio. What is very clear is that the market has become less pessimistic about TOTAL over the last month, with the P/E ratio rising from 5.5 back then to 7.8 today. If you like to buy stocks that could be turnaround opportunities, then this one might be a candidate; but if you're more sensitive to price, then you may feel the opportunity has passed.
Investors should be looking to buy stocks that the market is wrong about. If the reality for a company is not as bad as the P/E ratio indicates, then the share price should increase as the market realizes this. So this free visual report on analyst forecasts could hold the key to an excellent investment decision.
Of course you might be able to find a better stock than TOTAL. So you may wish to see this free collection of other companies that have grown earnings strongly.
If you spot an error that warrants correction, please contact the editor at editorial-team@simplywallst.com. This article by Simply Wall St is general in nature. It does not constitute a recommendation to buy or sell any stock, and does not take account of your objectives, or your financial situation. Simply Wall St has no position in the stocks mentioned.
We aim to bring you long-term focused research analysis driven by fundamental data. Note that our analysis may not factor in the latest price-sensitive company announcements or qualitative material. Thank you for reading.
