Tradelink Electronic Commerce Limited (HKG:536) Delivered A Better ROE Than Its Industry

One of the best investments we can make is in our own knowledge and skill set. With that in mind, this article will work through how we can use Return On Equity (ROE) to better understand a business. We'll use ROE to examine Tradelink Electronic Commerce Limited (HKG:536), by way of a worked example.
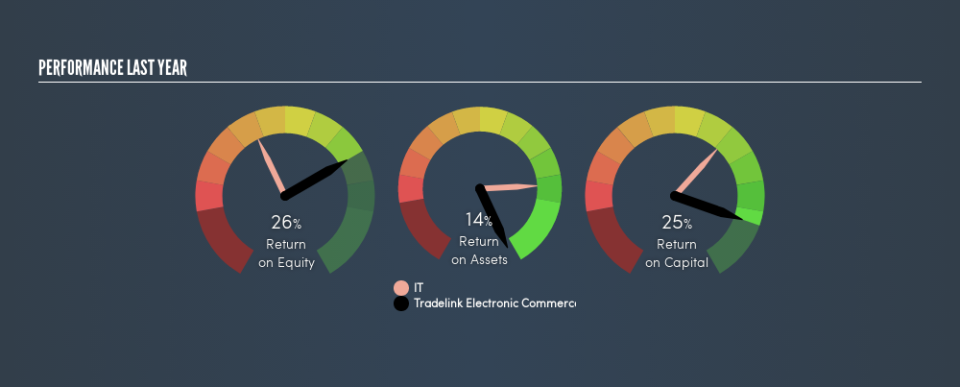
Tradelink Electronic Commerce has a ROE of 26%, based on the last twelve months. Another way to think of that is that for every HK$1 worth of equity in the company, it was able to earn HK$0.26.
See our latest analysis for Tradelink Electronic Commerce
How Do I Calculate Return On Equity?
The formula for ROE is:
Return on Equity = Net Profit ÷ Shareholders' Equity
Or for Tradelink Electronic Commerce:
26% = HK$90m ÷ HK$351m (Based on the trailing twelve months to December 2018.)
Most readers would understand what net profit is, but it’s worth explaining the concept of shareholders’ equity. It is all earnings retained by the company, plus any capital paid in by shareholders. The easiest way to calculate shareholders' equity is to subtract the company's total liabilities from the total assets.
What Does ROE Signify?
Return on Equity measures a company's profitability against the profit it has kept for the business (plus any capital injections). The 'return' is the yearly profit. That means that the higher the ROE, the more profitable the company is. So, as a general rule, a high ROE is a good thing. That means ROE can be used to compare two businesses.
Does Tradelink Electronic Commerce Have A Good ROE?
One simple way to determine if a company has a good return on equity is to compare it to the average for its industry. However, this method is only useful as a rough check, because companies do differ quite a bit within the same industry classification. As is clear from the image below, Tradelink Electronic Commerce has a better ROE than the average (12%) in the IT industry.
That is a good sign. In my book, a high ROE almost always warrants a closer look. For example, I often check if insiders have been buying shares .
How Does Debt Impact ROE?
Most companies need money -- from somewhere -- to grow their profits. The cash for investment can come from prior year profits (retained earnings), issuing new shares, or borrowing. In the first and second cases, the ROE will reflect this use of cash for investment in the business. In the latter case, the debt used for growth will improve returns, but won't affect the total equity. That will make the ROE look better than if no debt was used.
Tradelink Electronic Commerce's Debt And Its 26% ROE
Tradelink Electronic Commerce is free of net debt, which is a positive for shareholders. Its high ROE already points to a high quality business, but the lack of debt is a cherry on top. After all, with cash on the balance sheet, a company has a lot more optionality in good times and bad.
The Key Takeaway
Return on equity is a useful indicator of the ability of a business to generate profits and return them to shareholders. A company that can achieve a high return on equity without debt could be considered a high quality business. If two companies have around the same level of debt to equity, and one has a higher ROE, I'd generally prefer the one with higher ROE.
But ROE is just one piece of a bigger puzzle, since high quality businesses often trade on high multiples of earnings. The rate at which profits are likely to grow, relative to the expectations of profit growth reflected in the current price, must be considered, too. You can see how the company has grow in the past by looking at this FREE detailed graph of past earnings, revenue and cash flow.
Of course Tradelink Electronic Commerce may not be the best stock to buy. So you may wish to see this free collection of other companies that have high ROE and low debt.
We aim to bring you long-term focused research analysis driven by fundamental data. Note that our analysis may not factor in the latest price-sensitive company announcements or qualitative material.
If you spot an error that warrants correction, please contact the editor at editorial-team@simplywallst.com. This article by Simply Wall St is general in nature. It does not constitute a recommendation to buy or sell any stock, and does not take account of your objectives, or your financial situation. Simply Wall St has no position in the stocks mentioned. Thank you for reading.
