Transocean (RIG) Q2 Loss Wider Than Expected, Revenues Beat
Transocean RIG reported a second-quarter 2023 adjusted net loss of 15 cents per share, wider than the Zacks Consensus Estimate of a loss of 12 cents. This underperformance can be attributed to a weaker result from Harsh Environment floaters.The bottom line also deteriorated from the year-ago period’s recorded loss of 10 cents.
Total adjusted revenues of $748 million beat the Zacks Consensus Estimate of $724 million. The top line also improved 3.6% from the prior-year quarter’s reported figure of $722 million. This outperformance was primarily driven by higher operational days.
Transocean Ltd. Price, Consensus and EPS Surprise
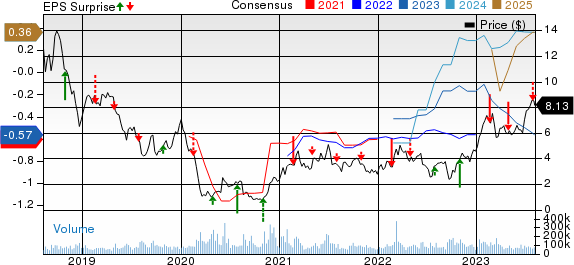
Transocean Ltd. price-consensus-eps-surprise-chart | Transocean Ltd. Quote
Segmental Revenue Breakup
Transocean’s Ultra-deepwater floaters contributed 73.5% to net contract drilling revenues, while Harsh Environment floaters accounted for the remaining 26.5%. Revenues from the Ultra-deepwater and Harsh Environment floaters totaled $536 million and $193 million, respectively, compared with the year-ago quarter’s reported figures of $451 million and $241 million.
Revenues from Ultra-deepwater exceeded our projection of $490.6 million, while that from Harsh Environment came in below our projection of $225.5 million.
Revenue efficiency was 97.2%, slightly lower than the 97.8% reported sequentially and year over year.
Day rates, Utilization & Backlog
Average day rates in the reported quarter increased to $367,000 from $358,100 in the year-ago quarter. The figure also beat our estimate of $365,600.
Average revenues per day from Ultra-deepwater floaters increased to $380,600 from $334,400 in the year-ago quarter. The same from Harsh Environment floaters, however, decreased to $332,000 from $406,000 in the comparable period of 2022.
The fleet utilization rate was 54.7% in the quarter, down from the prior-year period’s 528.2%.
Transocean’s backlog of $9.2 billion increased sequentially from $8.6 billion.
Costs, Capex & Balance Sheet
Operations and maintenance (O&M) costs increased to $484 million from $433 million a year ago. The company spent $76 million on capital investments in the second quarter. Cash used in operating activities totaled $157 million. Cash and cash equivalents amounted to $821 million as of Jun 30, 2023. Long-term debt totaled $7.15 billion, with a debt-to-capitalization of 40.7% as of the same date.
Guidance
For the third quarter of 2023, Transocean expects adjusted contract drilling revenues of $720 million. It also projects O&M expenses of approximately $540 million for the same time frame.
For full-year 2023, the company expects O&M expenses of $1.9 billion. It also anticipates adjusted contract revenues in the $2.9-$3 billion range.
General and administrative costs are projected to be $55 million. Annual expenses are anticipated to be $210 million.
RIG projects net interest expenses of $133 million in the third quarter and $470 million in 2023, including $38 million in capitalized interest.
Cash taxes are expected to reach $6.3 million for the same quarter and roughly $45 million for full-year 2023.
For the third quarter, the company expects capital expenditures (CapEx) of $705 million, of which $33 million will be spent on the Deepwater Atlas and Deepwater Titan. RIG anticipates $270 million in CapEx for the entire year.
Zacks Rank and Key Picks
Currently, RIG carries a Zacks Rank #4 (Sell).
Some better-ranked stocks for investors interested in the energy sector are Murphy USA MUSA, sporting a Zacks Rank #1 (Strong Buy), and Evolution Petroleum EPM and Archrock AROC, both carrying a Zacks Rank #2 (Buy) at present. You can see the complete list of today’s Zacks #1 Rank stocks here.
Murphy USA is valued at around $6.55 billion. In the past year, its shares have risen 5.6%
MUSA currently pays a dividend of $1.52 per share, or 0.51% on an annual basis. Its payout ratio currently sits at 6% of earnings.
Evolution Petroleum is worth approximately $319.05 million. EPM currently pays a dividend of 48 cents per share, or 5.20% on an annual basis.
The company currently has a forward P/E ratio of 8.88. In comparison, its industry has an average forward P/E of 13.60, which means EPM is trading at a discount to the group.
Archrock is valued at around $2.01 billion. It delivered an average earnings surprise of 15.08% for the last four quarters and its current dividend yield is 4.67%.
Archrock is a provider of natural gas contract compression services and aftermarket services of compression equipment.
Want the latest recommendations from Zacks Investment Research? Today, you can download 7 Best Stocks for the Next 30 Days. Click to get this free report
Transocean Ltd. (RIG) : Free Stock Analysis Report
Murphy USA Inc. (MUSA) : Free Stock Analysis Report
Evolution Petroleum Corporation, Inc. (EPM) : Free Stock Analysis Report
Archrock, Inc. (AROC) : Free Stock Analysis Report
