Transurban Group's Dividend Analysis
Understanding the Upcoming Dividend Payout and Historical Performance
Transurban Group(TRAUF) recently announced a dividend of $0.3 per share, payable on 2024-02-13, with the ex-dividend date set for 2023-12-28. As investors look forward to this upcoming payment, the spotlight also shines on the company's dividend history, yield, and growth rates. Using the data from GuruFocus, let's look into Transurban Group's dividend performance and assess its sustainability.
What Does Transurban Group Do?
Warning! GuruFocus has detected 10 Warning Signs with TRAUF.
This Powerful Chart Made Peter Lynch 29% A Year For 13 Years
How to calculate the intrinsic value of a stock?
Transurban Group is an owner/operator of toll roads in Melbourne, Sydney, and Brisbane. It also owns toll roads in Virginia, USA and Montreal, Canada. The weighted average concession life across the portfolio is about 28 years. Australian assets contribute around 90% of proportional revenue.
A Glimpse at Transurban Group's Dividend History
Transurban Group has maintained a consistent dividend payment record since 2011. Dividends are currently distributed on a bi-annual basis. Below is a chart showing annual Dividends Per Share for tracking historical trends.
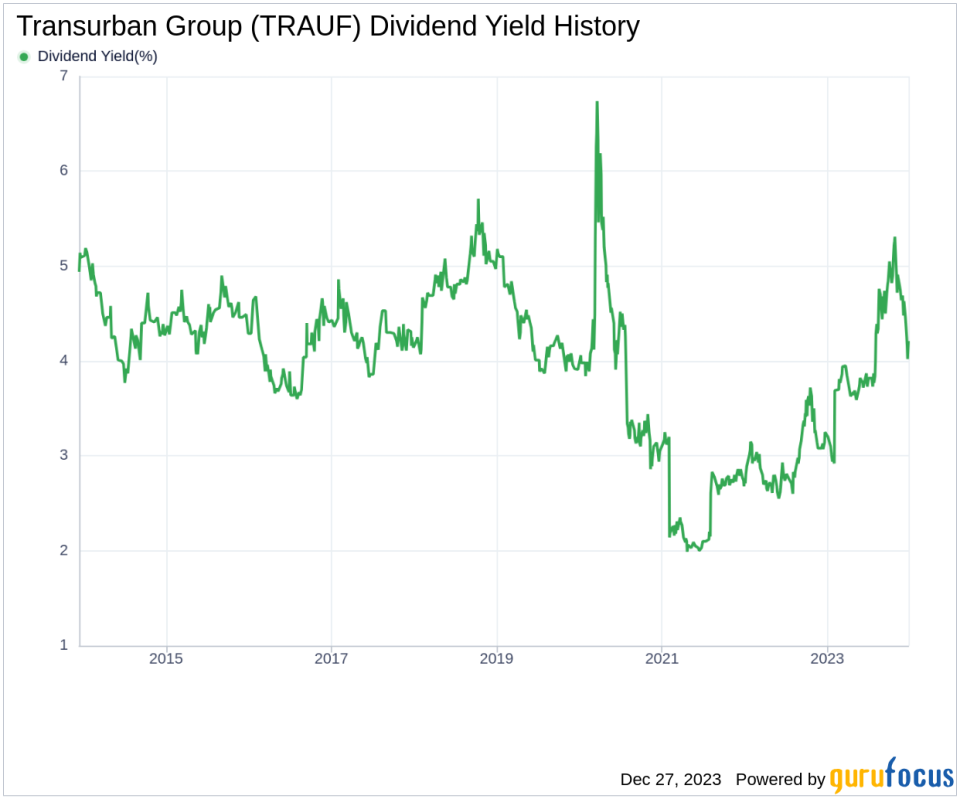
Breaking Down Transurban Group's Dividend Yield and Growth
As of today, Transurban Group currently has a 12-month trailing dividend yield of 4.15% and a 12-month forward dividend yield of 4.31%. This suggests an expectation of increased dividend payments over the next 12 months.
Over the past three years, Transurban Group's annual dividend growth rate was 7.60%. Extended to a five-year horizon, this rate decreased to -2.90% per year. And over the past decade, Transurban Group's annual dividends per share growth rate stands at 3.90%.
Based on Transurban Group's dividend yield and five-year growth rate, the 5-year yield on cost of Transurban Group stock as of today is approximately 3.58%.
The Sustainability Question: Payout Ratio and Profitability
To assess the sustainability of the dividend, one needs to evaluate the company's payout ratio. The dividend payout ratio provides insights into the portion of earnings the company distributes as dividends. A lower ratio suggests that the company retains a significant part of its earnings, thereby ensuring the availability of funds for future growth and unexpected downturns. As of 2023-06-30, Transurban Group's dividend payout ratio is 27.62, which may suggest that the company's dividend could be sustainable.
Transurban Group's profitability rank, offers an understanding of the company's earnings prowess relative to its peers. GuruFocus ranks Transurban Group's profitability 6 out of 10 as of 2023-06-30, suggesting fair profitability. The company has reported net profit in 8 years out of the past 10 years.
Growth Metrics: The Future Outlook
To ensure the sustainability of dividends, a company must have robust growth metrics. Transurban Group's growth rank of 6 out of 10 suggests that the company has a fair growth outlook.
Revenue is the lifeblood of any company, and Transurban Group's revenue per share, combined with the 3-year revenue growth rate, indicates a strong revenue model. Transurban Group's revenue has increased by approximately 0.90% per year on average, a rate that underperforms approximately 57.27% of global competitors.
Concluding Thoughts on Transurban Group's Dividend Prospects
In conclusion, Transurban Group's upcoming dividend, historical dividend growth, and current payout ratio paint a picture of a company that has been consistent in rewarding its shareholders. The profitability and growth metrics, while not leading the industry, are solid enough to suggest that the dividends could be maintained. Investors interested in dividend-paying stocks should consider the company's track record, its ability to generate revenue, and the sustainability of its payout ratio when making investment decisions. For those seeking additional investment opportunities, GuruFocus Premium users can screen for high-dividend yield stocks using the High Dividend Yield Screener.
This article, generated by GuruFocus, is designed to provide general insights and is not tailored financial advice. Our commentary is rooted in historical data and analyst projections, utilizing an impartial methodology, and is not intended to serve as specific investment guidance. It does not formulate a recommendation to purchase or divest any stock and does not consider individual investment objectives or financial circumstances. Our objective is to deliver long-term, fundamental data-driven analysis. Be aware that our analysis might not incorporate the most recent, price-sensitive company announcements or qualitative information. GuruFocus holds no position in the stocks mentioned herein.
This article first appeared on GuruFocus.
