Travis Perkins (LON:TPK) earnings and shareholder returns have been trending downwards for the last five years, but the stock climbs 4.3% this past week
The main aim of stock picking is to find the market-beating stocks. But the main game is to find enough winners to more than offset the losers So we wouldn't blame long term Travis Perkins plc (LON:TPK) shareholders for doubting their decision to hold, with the stock down 48% over a half decade. Shareholders have had an even rougher run lately, with the share price down 14% in the last 90 days.
On a more encouraging note the company has added UK£71m to its market cap in just the last 7 days, so let's see if we can determine what's driven the five-year loss for shareholders.
Check out our latest analysis for Travis Perkins
To paraphrase Benjamin Graham: Over the short term the market is a voting machine, but over the long term it's a weighing machine. One imperfect but simple way to consider how the market perception of a company has shifted is to compare the change in the earnings per share (EPS) with the share price movement.
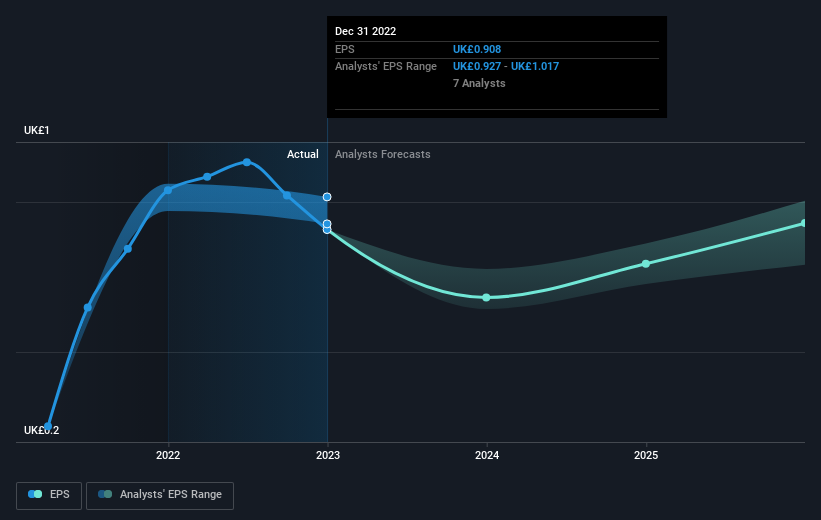
During the five years over which the share price declined, Travis Perkins' earnings per share (EPS) dropped by 2.6% each year. This reduction in EPS is less than the 12% annual reduction in the share price. This implies that the market was previously too optimistic about the stock. The low P/E ratio of 8.95 further reflects this reticence.
The company's earnings per share (over time) is depicted in the image below (click to see the exact numbers).
This free interactive report on Travis Perkins' earnings, revenue and cash flow is a great place to start, if you want to investigate the stock further.
What About Dividends?
As well as measuring the share price return, investors should also consider the total shareholder return (TSR). The TSR incorporates the value of any spin-offs or discounted capital raisings, along with any dividends, based on the assumption that the dividends are reinvested. So for companies that pay a generous dividend, the TSR is often a lot higher than the share price return. We note that for Travis Perkins the TSR over the last 5 years was -28%, which is better than the share price return mentioned above. This is largely a result of its dividend payments!
A Different Perspective
While the broader market gained around 4.1% in the last year, Travis Perkins shareholders lost 10% (even including dividends). However, keep in mind that even the best stocks will sometimes underperform the market over a twelve month period. Regrettably, last year's performance caps off a bad run, with the shareholders facing a total loss of 5% per year over five years. We realise that Baron Rothschild has said investors should "buy when there is blood on the streets", but we caution that investors should first be sure they are buying a high quality business. I find it very interesting to look at share price over the long term as a proxy for business performance. But to truly gain insight, we need to consider other information, too. Even so, be aware that Travis Perkins is showing 1 warning sign in our investment analysis , you should know about...
Of course, you might find a fantastic investment by looking elsewhere. So take a peek at this free list of companies we expect will grow earnings.
Please note, the market returns quoted in this article reflect the market weighted average returns of stocks that currently trade on British exchanges.
Have feedback on this article? Concerned about the content? Get in touch with us directly. Alternatively, email editorial-team (at) simplywallst.com.
This article by Simply Wall St is general in nature. We provide commentary based on historical data and analyst forecasts only using an unbiased methodology and our articles are not intended to be financial advice. It does not constitute a recommendation to buy or sell any stock, and does not take account of your objectives, or your financial situation. We aim to bring you long-term focused analysis driven by fundamental data. Note that our analysis may not factor in the latest price-sensitive company announcements or qualitative material. Simply Wall St has no position in any stocks mentioned.
Join A Paid User Research Session
You’ll receive a US$30 Amazon Gift card for 1 hour of your time while helping us build better investing tools for the individual investors like yourself. Sign up here
