Tri Pointe Homes, Inc.'s (NYSE:TPH) Stock's On An Uptrend: Are Strong Financials Guiding The Market?
Most readers would already be aware that Tri Pointe Homes' (NYSE:TPH) stock increased significantly by 22% over the past three months. Given that the market rewards strong financials in the long-term, we wonder if that is the case in this instance. In this article, we decided to focus on Tri Pointe Homes' ROE.
ROE or return on equity is a useful tool to assess how effectively a company can generate returns on the investment it received from its shareholders. In simpler terms, it measures the profitability of a company in relation to shareholder's equity.
View our latest analysis for Tri Pointe Homes
How Do You Calculate Return On Equity?
The formula for ROE is:
Return on Equity = Net Profit (from continuing operations) ÷ Shareholders' Equity
So, based on the above formula, the ROE for Tri Pointe Homes is:
20% = US$570m ÷ US$2.9b (Based on the trailing twelve months to March 2023).
The 'return' is the amount earned after tax over the last twelve months. Another way to think of that is that for every $1 worth of equity, the company was able to earn $0.20 in profit.
What Is The Relationship Between ROE And Earnings Growth?
So far, we've learned that ROE is a measure of a company's profitability. Depending on how much of these profits the company reinvests or "retains", and how effectively it does so, we are then able to assess a company’s earnings growth potential. Generally speaking, other things being equal, firms with a high return on equity and profit retention, have a higher growth rate than firms that don’t share these attributes.
Tri Pointe Homes' Earnings Growth And 20% ROE
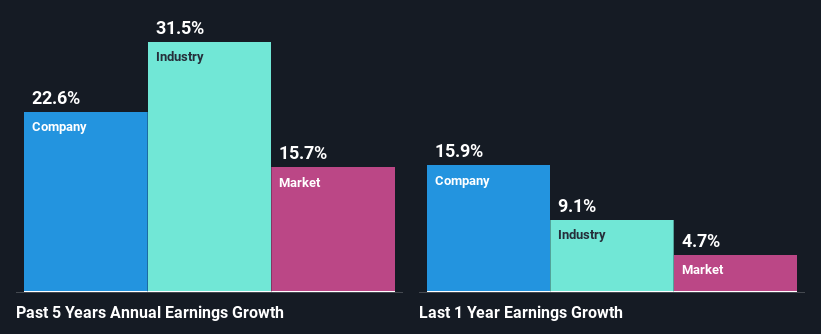
To begin with, Tri Pointe Homes seems to have a respectable ROE. Even when compared to the industry average of 20% the company's ROE looks quite decent. This certainly adds some context to Tri Pointe Homes' exceptional 23% net income growth seen over the past five years. However, there could also be other drivers behind this growth. For example, it is possible that the company's management has made some good strategic decisions, or that the company has a low payout ratio.
As a next step, we compared Tri Pointe Homes' net income growth with the industry and were disappointed to see that the company's growth is lower than the industry average growth of 31% in the same period.
The basis for attaching value to a company is, to a great extent, tied to its earnings growth. It’s important for an investor to know whether the market has priced in the company's expected earnings growth (or decline). Doing so will help them establish if the stock's future looks promising or ominous. One good indicator of expected earnings growth is the P/E ratio which determines the price the market is willing to pay for a stock based on its earnings prospects. So, you may want to check if Tri Pointe Homes is trading on a high P/E or a low P/E, relative to its industry.
Is Tri Pointe Homes Efficiently Re-investing Its Profits?
Tri Pointe Homes doesn't pay any dividend to its shareholders, meaning that the company has been reinvesting all of its profits into the business. This is likely what's driving the high earnings growth number discussed above.
Conclusion
Overall, we are quite pleased with Tri Pointe Homes' performance. Specifically, we like that the company is reinvesting a huge chunk of its profits at a high rate of return. This of course has caused the company to see a good amount of growth in its earnings. Having said that, on studying current analyst estimates, we were concerned to see that while the company has grown its earnings in the past, analysts expect its earnings to shrink in the future. To know more about the latest analysts predictions for the company, check out this visualization of analyst forecasts for the company.
Have feedback on this article? Concerned about the content? Get in touch with us directly. Alternatively, email editorial-team (at) simplywallst.com.
This article by Simply Wall St is general in nature. We provide commentary based on historical data and analyst forecasts only using an unbiased methodology and our articles are not intended to be financial advice. It does not constitute a recommendation to buy or sell any stock, and does not take account of your objectives, or your financial situation. We aim to bring you long-term focused analysis driven by fundamental data. Note that our analysis may not factor in the latest price-sensitive company announcements or qualitative material. Simply Wall St has no position in any stocks mentioned.
Join A Paid User Research Session
You’ll receive a US$30 Amazon Gift card for 1 hour of your time while helping us build better investing tools for the individual investors like yourself. Sign up here
