Trinity Industries Inc's Dividend Analysis
An In-depth Look at the Company's Dividend Performance and Its Sustainability
Trinity Industries Inc (NYSE:TRN) recently announced a dividend of $0.26 per share, payable on 2023-10-31, with the ex-dividend date set for 2023-10-12. As investors look forward to this upcoming payment, the spotlight also shines on the company's dividend history, yield, and growth rates. Using the data from GuruFocus, let's look into Trinity Industries Inc's dividend performance and assess its sustainability.
What Does Trinity Industries Inc Do?
Warning! GuruFocus has detected 10 Warning Signs with TRN. Click here to check it out.
This Powerful Chart Made Peter Lynch 29% A Year For 13 Years
How to calculate the intrinsic value of a stock?
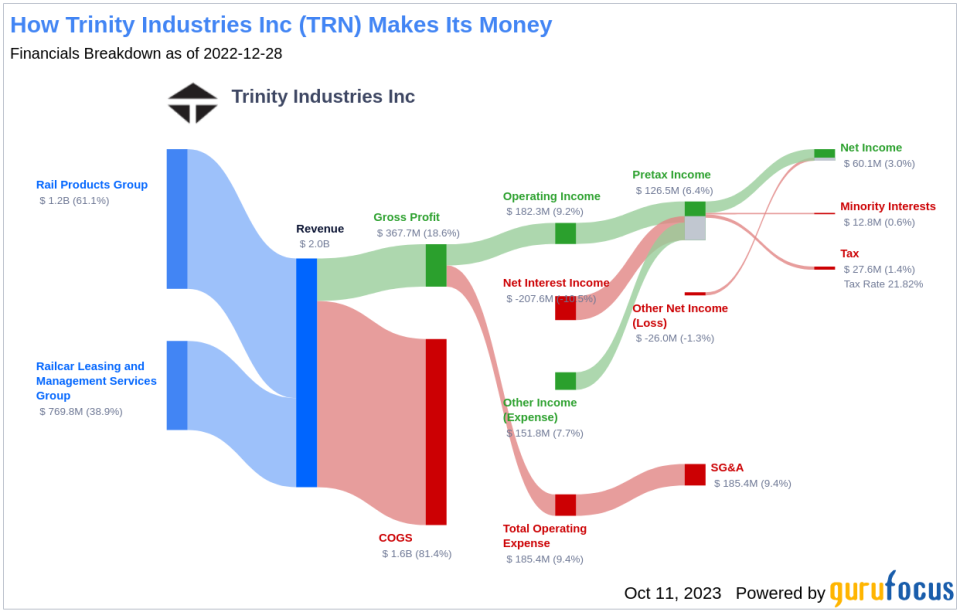
Trinity Industries Inc sells and leases railroad products and railcar maintenance services in North America. The company operates under the name TrinityRail in three main segments: railcar leasing and management services, which owns railcars and provides fleet management and administration services; rail products, which builds, sells, and modifies freight and tank railcars and their components; and all other, which sells highway products such as guardrail and other highway barriers. Customers include railroads, leasing companies, and shipping companies in the industries of agriculture, construction, consumer products, energy, and chemicals.
A Glimpse at Trinity Industries Inc's Dividend History
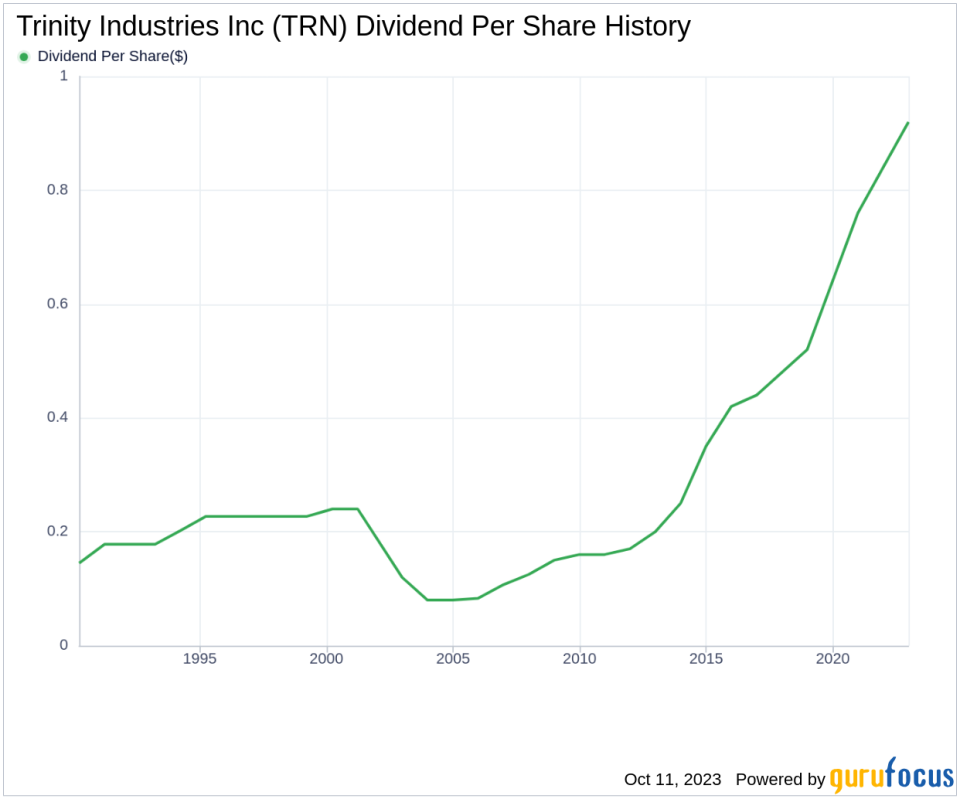
Trinity Industries Inc has maintained a consistent dividend payment record since 1985. Dividends are currently distributed on a quarterly basis. Trinity Industries Inc has increased its dividend each year since 2003. The stock is thus listed as a dividend achiever, an honor that is given to companies that have increased their dividend each year for at least the past 20 years.
Breaking Down Trinity Industries Inc's Dividend Yield and Growth
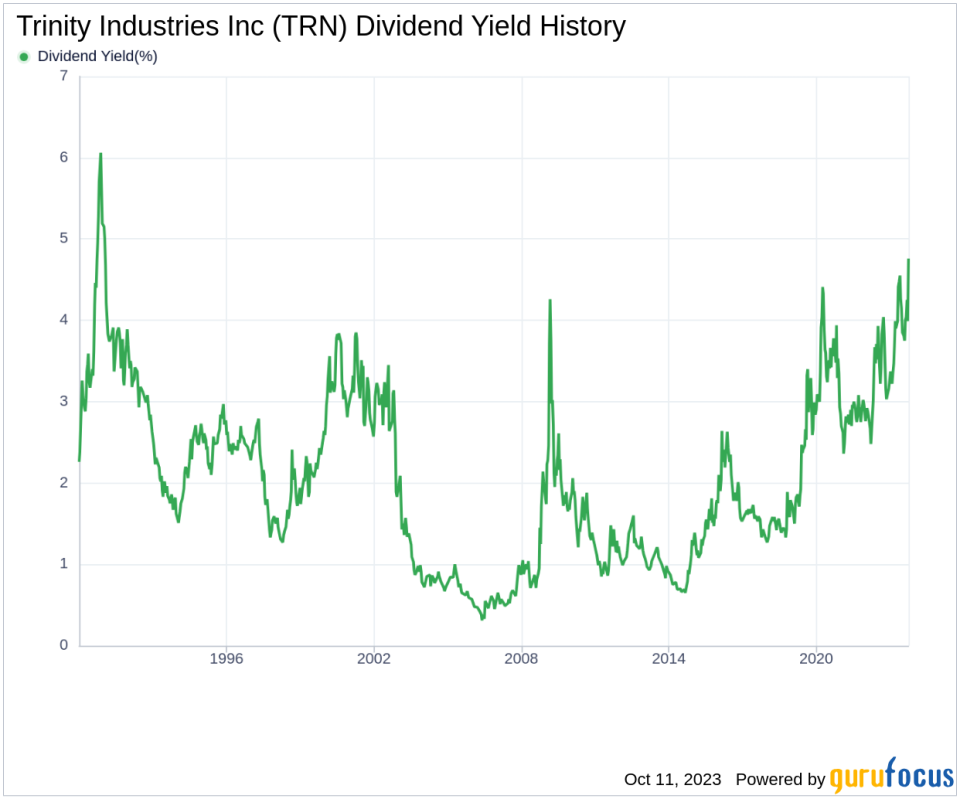
As of today, Trinity Industries Inc currently has a 12-month trailing dividend yield of 4.56% and a 12-month forward dividend yield of 4.68%. This suggests an expectation of increased dividend payments over the next 12 months.
Over the past three years, Trinity Industries Inc's annual dividend growth rate was 12.90%. Extended to a five-year horizon, this rate increased to 14.90% per year. And over the past decade, Trinity Industries Inc's annual dividends per share growth rate stands at an impressive 15.50%.
Based on Trinity Industries Inc's dividend yield and five-year growth rate, the 5-year yield on cost of Trinity Industries Inc stock as of today is approximately 9.13%.
The Sustainability Question: Payout Ratio and Profitability
To assess the sustainability of the dividend, one needs to evaluate the company's payout ratio. The dividend payout ratio provides insights into the portion of earnings the company distributes as dividends. A lower ratio suggests that the company retains a significant part of its earnings, thereby ensuring the availability of funds for future growth and unexpected downturns. As of 2023-06-30, Trinity Industries Inc's dividend payout ratio is 0.88, which may suggest that the company's dividend may not be sustainable.
Trinity Industries Inc's profitability rank, offers an understanding of the company's earnings prowess relative to its peers. GuruFocus ranks Trinity Industries Inc's profitability 7 out of 10 as of 2023-06-30, suggesting good profitability prospects. The company has reported net profit in 9 years out of past 10 years.
Growth Metrics: The Future Outlook
To ensure the sustainability of dividends, a company must have robust growth metrics. Trinity Industries Inc's growth rank of 7 out of 10 suggests that the company's growth trajectory is good relative to its competitors.
Revenue is the lifeblood of any company, and Trinity Industries Inc's revenue per share, combined with the 3-year revenue growth rate, indicates a strong revenue model. Trinity Industries Inc's revenue has increased by approximately 2.80% per year on average, a rate that underperforms than approximately 55.64% of global competitors.
The company's 3-year EPS growth rate showcases its capability to grow its earnings, a critical component for sustaining dividends in the long run. During the past three years, Trinity Industries Inc's earnings increased by approximately 2.00% per year on average, a rate that underperforms than approximately 62.62% of global competitors.
Next Steps
Investors considering Trinity Industries Inc should take into account its strong dividend history, growth rate, and yield. However, the company's high payout ratio and underperformance in revenue and earnings growth compared to competitors are areas of concern. The sustainability of the dividend depends on how well Trinity Industries Inc can balance these factors moving forward. GuruFocus Premium users can screen for high-dividend yield stocks using the High Dividend Yield Screener.
This article, generated by GuruFocus, is designed to provide general insights and is not tailored financial advice. Our commentary is rooted in historical data and analyst projections, utilizing an impartial methodology, and is not intended to serve as specific investment guidance. It does not formulate a recommendation to purchase or divest any stock and does not consider individual investment objectives or financial circumstances. Our objective is to deliver long-term, fundamental data-driven analysis. Be aware that our analysis might not incorporate the most recent, price-sensitive company announcements or qualitative information. GuruFocus holds no position in the stocks mentioned herein.
This article first appeared on GuruFocus.
