Is Trinity Industries (TRN) Too Good to Be True? A Comprehensive Analysis of a Potential Value Trap
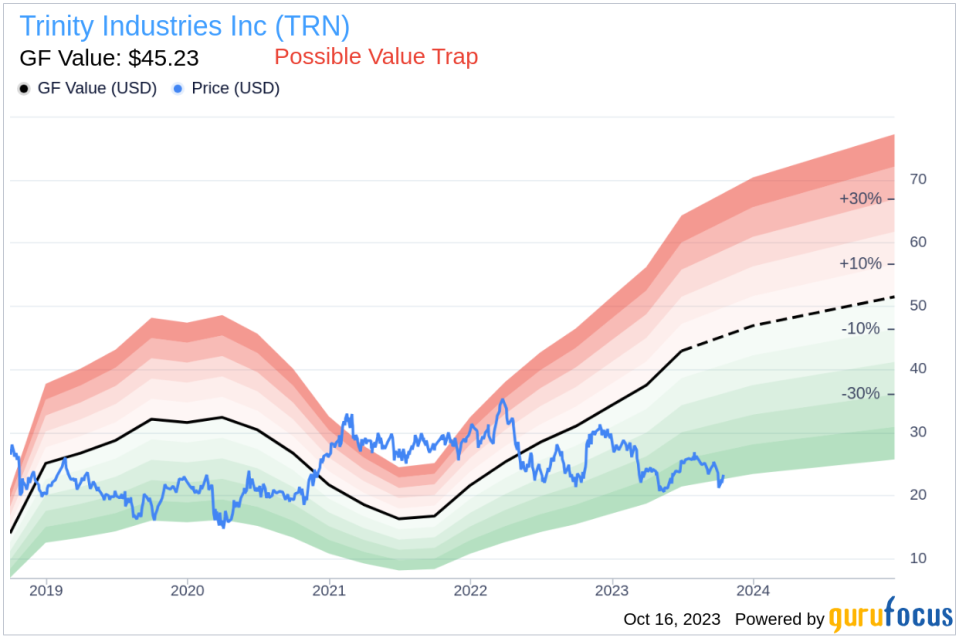
Value-focused investors are always on the hunt for stocks that are priced below their intrinsic value. One such stock that merits attention is Trinity Industries Inc (NYSE:TRN). The stock, which is currently priced at $23.19, recorded a gain of 5.85% in a day and a 3-month decrease of 13.85%. The stock's fair valuation is $45.23, as indicated by its GF Value.
Understanding GF Value
The GF Value represents the current intrinsic value of a stock derived from our exclusive method. The GF Value Line on our summary page gives an overview of the fair value that the stock should be traded at. It is calculated based on three factors:
Historical multiples (PE Ratio, PS Ratio, PB Ratio and Price-to-Free-Cash-Flow) that the stock has traded at.
GuruFocus adjustment factor based on the company's past returns and growth.
Future estimates of the business performance.
We believe the GF Value Line is the fair value that the stock should be traded at. The stock price will most likely fluctuate around the GF Value Line. If the stock price is significantly above the GF Value Line, it is overvalued and its future return is likely to be poor. On the other hand, if it is significantly below the GF Value Line, its future return will likely be higher.
Investigating the Risks
However, investors need to consider a more in-depth analysis before making an investment decision. Despite its seemingly attractive valuation, certain risk factors associated with Trinity Industries should not be ignored. These risks are primarily reflected through its low Altman Z-score of 0.79. These indicators suggest that Trinity Industries, despite its apparent undervaluation, might be a potential value trap. This complexity underlines the importance of thorough due diligence in investment decision-making.
Understanding the Altman Z-Score
Before delving into the details, let's understand what the Altman Z-score entails. Invented by New York University Professor Edward I. Altman in 1968, the Z-Score is a financial model that predicts the probability of a company entering bankruptcy within a two-year time frame. The Altman Z-Score combines five different financial ratios, each weighted to create a final score. A score below 1.8 suggests a high likelihood of financial distress, while a score above 3 indicates a low risk.
Company Snapshot
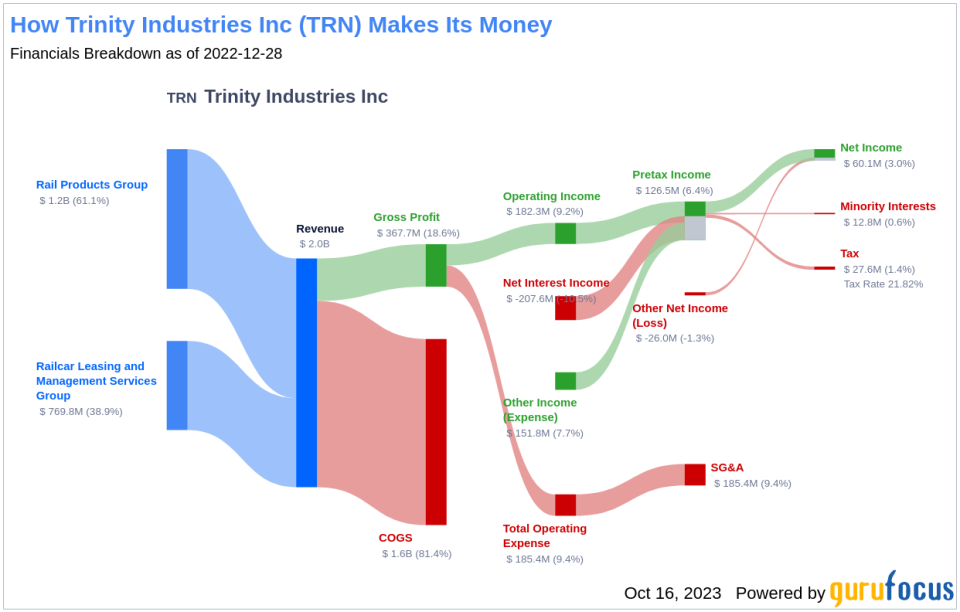
Trinity Industries Inc. sells and leases railroad products and railcar maintenance services in North America. The company operates under the name TrinityRail in three main segments: railcar leasing and management services, which owns railcars and provides fleet management and administration services; rail products, which builds, sells, and modifies freight and tank railcars and their components; and all other, which sells highway products such as guardrail and other highway barriers. Customers include railroads, leasing companies, and shipping companies in the industries of agriculture, construction, consumer products, energy, and chemicals.
Trinity Industries's Low Altman Z-Score: A Breakdown of Key Drivers
A dissection of Trinity Industries's Altman Z-score reveals Trinity Industries's financial health may be weak, suggesting possible financial distress:
The Retained Earnings to Total Assets ratio provides insights into a company's capability to reinvest its profits or manage debt. Evaluating Trinity Industries's historical data, 2021: 0.16; 2022: 0.12; 2023: 0.11, we observe a declining trend in this ratio. This downward movement indicates Trinity Industries's diminishing ability to reinvest in its business or effectively manage its debt. Consequently, it exerts a negative impact on its Z-Score.
Conclusion
Despite Trinity Industries (NYSE:TRN)'s seemingly attractive valuation, its low Altman Z-Score and declining Retained Earnings to Total Assets ratio raise red flags, suggesting it might be a potential value trap. Therefore, investors need to exercise caution and conduct thorough due diligence before making an investment decision.
GuruFocus Premium members can find stocks with high Altman Z-Score using the following Screener: Walter Schloss Screen .
This article, generated by GuruFocus, is designed to provide general insights and is not tailored financial advice. Our commentary is rooted in historical data and analyst projections, utilizing an impartial methodology, and is not intended to serve as specific investment guidance. It does not formulate a recommendation to purchase or divest any stock and does not consider individual investment objectives or financial circumstances. Our objective is to deliver long-term, fundamental data-driven analysis. Be aware that our analysis might not incorporate the most recent, price-sensitive company announcements or qualitative information. GuruFocus holds no position in the stocks mentioned herein.
This article first appeared on GuruFocus.
