Trupanion (TRUP): A Smart Investment or a Value Trap? An In-Depth Exploration
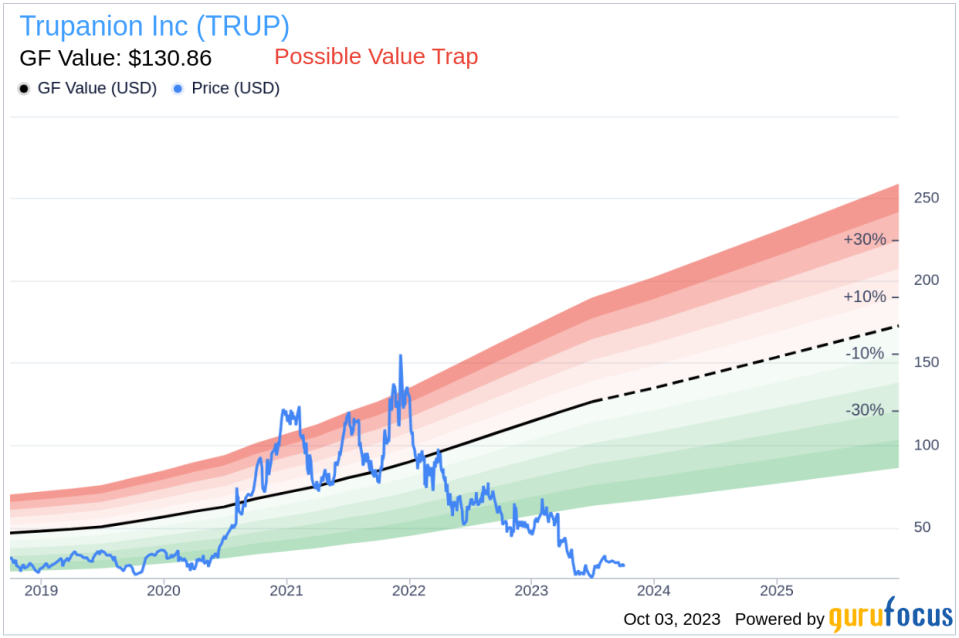
Value-focused investors are always on the hunt for stocks that are priced below their intrinsic value. One such stock that merits attention is Trupanion Inc (NASDAQ:TRUP). The stock, which is currently priced at 26.11, recorded a loss of 6.25% in a day and a 3-month increase of 25.37%. The stock's fair valuation is $130.86, as indicated by its GF Value.
Understanding the GF Value
The GF Value represents the current intrinsic value of a stock derived from our exclusive method. The GF Value Line on our summary page gives an overview of the fair value that the stock should be traded at. It is calculated based on three factors: historical multiples (PE Ratio, PS Ratio, PB Ratio and Price-to-Free-Cash-Flow) that the stock has traded at, GuruFocus adjustment factor based on the company's past returns and growth, and future estimates of the business performance.
We believe the GF Value Line is the fair value that the stock should be traded at. The stock price will most likely fluctuate around the GF Value Line. If the stock price is significantly above the GF Value Line, it is overvalued and its future return is likely to be poor. On the other hand, if it is significantly below the GF Value Line, its future return will likely be higher.
Digging Deeper: Trupanion's Financial Health
However, investors need to consider a more in-depth analysis before making an investment decision. Despite its seemingly attractive valuation, certain risk factors associated with Trupanion should not be ignored. These risks are primarily reflected through its low Piotroski F-score of 2. These indicators suggest that Trupanion, despite its apparent undervaluation, might be a potential value trap. This complexity underlines the importance of thorough due diligence in investment decision-making.
Decoding the Piotroski F-Score
The Piotroski F-score, created by accounting professor Joseph Piotroski, is a tool used to assess the strength of a company's financial health. The score is based on nine criteria that fall into three categories: profitability, leverage/liquidity/ source of funds, and operating efficiency. The overall score ranges from 0 to 9, with higher scores indicating healthier financials. Trupanion's current Piotroski F-Score, however, falls in the lower end of this spectrum, indicating potential red flags for investors.
Trupanion: A Closer Look
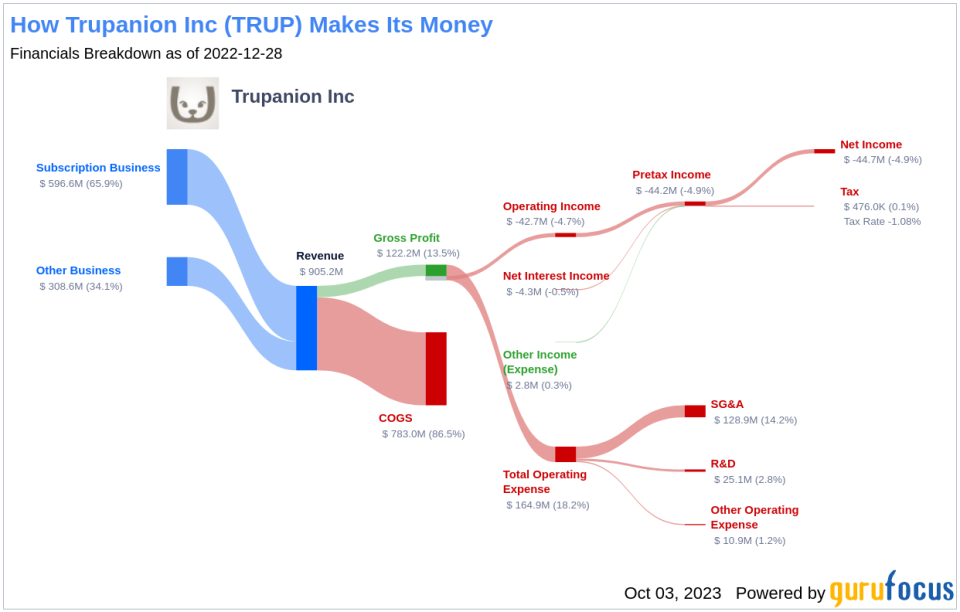
Trupanion Inc is a specialty insurance products provider in the United States. Its core business is the sale of insurance products tailor-made for pets, especially cats and dogs. It operates in two business segments: The subscription business segment generates revenue primarily from subscription fees related to the Company's direct-to-consumer products and Other business segment is comprised of revenue from other product offerings that generally have a business-to-business relationship and a different margin profile than our subscription business segment, including revenue from writing policies on behalf of third parties and revenue from other products and software solutions.
Analysis of Trupanion's Profitability
Firstly, let's address profitability. One significant component of the F-Score is a positive return on assets (ROA). A closer look at Trupanion's ROA reveals a worrying trend of negative returns. This indicates the company's inability to generate profit from its assets - a fundamental concern for any investor.
Let's delve deeper into Trupanion's financial health by examining the decline in its return on assets (ROA) over the past three years. The data indicates 2021: -6.44; 2022: -6.23; 2023: -8.92, when expressed in percentages. Such a decrease is concerning, as the Piotroski F-Score penalizes companies with lower current ROA compared to the previous period. This ongoing decline highlights another potential risk associated with investing in Trupanion.
Leverage, Liquidity and Source of Funds: A Worrying Trend
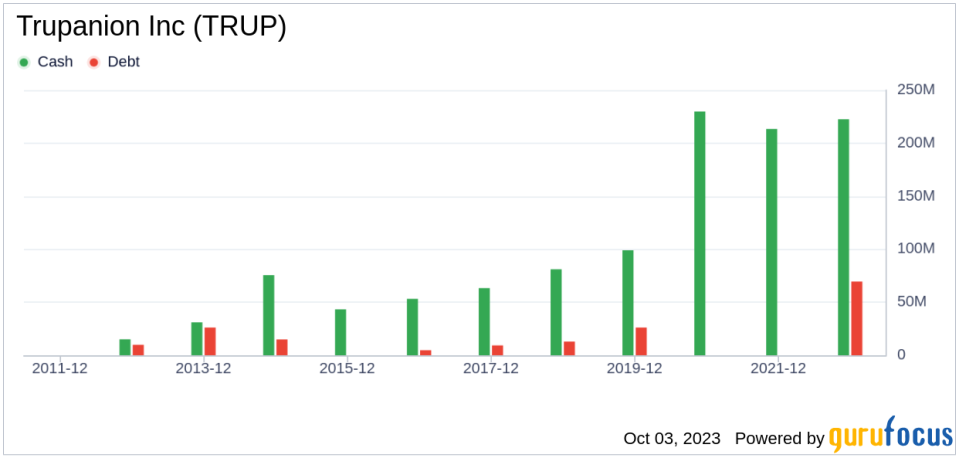
Assessing the aspect of leverage, liquidity, and sources of funds, Trupanion demonstrates an alarming rise in its debt-to-total assets ratio over the past three years. The provided data shows 2021: 0; 2022: 0.09; 2023: 0.14, expressed as percentages. A higher debt ratio suggests that Trupanion is increasingly financing its assets through debt, thereby escalating its financial risk. The Piotroski F-Score views this as a negative indicator, further cautioning investors about Trupanion.
Operating Efficiency: A Darker Picture
Examining the data provided: 2021: 40.14; 2022: 40.74; 2023: 41.38, it becomes evident that Trupanion has seen an increase in its Diluted Average Shares Outstanding over the past three years. This trend signals that the company has issued more shares. While issuing additional shares can provide immediate capital for the business, it can also lead to the dilution of existing shares' value. This dilution occurs because the earnings of the company now have to be divided among a larger pool of shares, which could decrease Earnings Per Share (EPS). Consequently, if the company's earnings don't grow at a pace that matches or exceeds this share increase, it could lead to a reduction in the value perceived by existing shareholders, potentially impacting their investment returns. Hence, while additional share issuance may provide necessary capital, it is important to monitor its impact on shareholder value carefully.
In terms of operational efficiency, another key indicator, Trupanion has unfortunately reported a declining trend in asset turnover over the past three years, as evidenced by the data: 2021: 1.38; 2022: 1.37; 2023: 1.48 (expressed in percentages). Asset turnover measures how effectively a company uses its assets to generate sales, and a decrease in this ratio can indicate a drop in efficiency. This could be due to various factors, such as underutilization of assets or a decline in the market demand for the company's products or services. Consequently, this downward trend in asset turnover implies that Trupanion may need to revisit its operational strategies to improve the utilization of its assets and boost its sales volume.
Conclusion: Trupanion as a Potential Value Trap
While the Piotroski F-score is not the only lens through which to view a potential investment, it is a robust and comprehensive tool for evaluating a company's financial health. Unfortunately for Trupanion, its current score suggests potential troubles. With a declining ROA, an increasing debt ratio, and a decrease in operational efficiency, Trupanion presents several concerning signals for potential investors. Despite its seemingly attractive valuation, these indicators suggest that Trupanion might be a potential value trap, underlining the importance of thorough due diligence in investment decision-making.
GuruFocus Premium members can find stocks with high Piotroski F-score using the following Screener: Piotroski F-score screener .
This article first appeared on GuruFocus.
