TUI (ETR:TUI1) earnings and shareholder returns have been trending downwards for the last five years, but the stock rallies 6.9% this past week
Long term investing works well, but it doesn't always work for each individual stock. We don't wish catastrophic capital loss on anyone. Imagine if you held TUI AG (ETR:TUI1) for half a decade as the share price tanked 93%. And we doubt long term believers are the only worried holders, since the stock price has declined 60% over the last twelve months. But it's up 6.9% in the last week. We really hope anyone holding through that price crash has a diversified portfolio. Even when you lose money, you don't have to lose the lesson.
The recent uptick of 6.9% could be a positive sign of things to come, so let's take a look at historical fundamentals.
View our latest analysis for TUI
While the efficient markets hypothesis continues to be taught by some, it has been proven that markets are over-reactive dynamic systems, and investors are not always rational. One way to examine how market sentiment has changed over time is to look at the interaction between a company's share price and its earnings per share (EPS).
TUI became profitable within the last five years. Most would consider that to be a good thing, so it's counter-intuitive to see the share price declining. Other metrics might give us a better handle on how its value is changing over time.
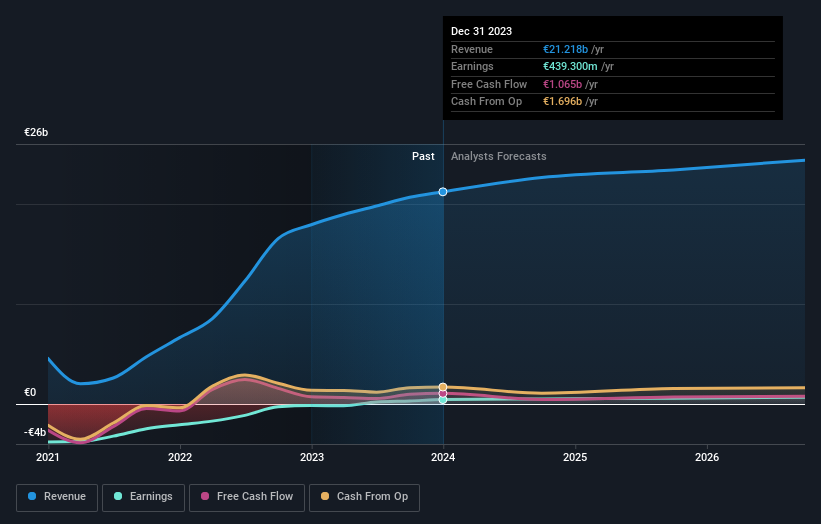
In contrast to the share price, revenue has actually increased by 1.3% a year in the five year period. A more detailed examination of the revenue and earnings may or may not explain why the share price languishes; there could be an opportunity.
You can see below how earnings and revenue have changed over time (discover the exact values by clicking on the image).
TUI is a well known stock, with plenty of analyst coverage, suggesting some visibility into future growth. You can see what analysts are predicting for TUI in this interactive graph of future profit estimates.
What About The Total Shareholder Return (TSR)?
We'd be remiss not to mention the difference between TUI's total shareholder return (TSR) and its share price return. Arguably the TSR is a more complete return calculation because it accounts for the value of dividends (as if they were reinvested), along with the hypothetical value of any discounted capital that have been offered to shareholders. Dividends have been really beneficial for TUI shareholders, and that cash payout explains why its total shareholder loss of 73%, over the last 5 years, isn't as bad as the share price return.
A Different Perspective
TUI shareholders are down 25% for the year, but the market itself is up 8.7%. However, keep in mind that even the best stocks will sometimes underperform the market over a twelve month period. Regrettably, last year's performance caps off a bad run, with the shareholders facing a total loss of 12% per year over five years. Generally speaking long term share price weakness can be a bad sign, though contrarian investors might want to research the stock in hope of a turnaround. While it is well worth considering the different impacts that market conditions can have on the share price, there are other factors that are even more important. For example, we've discovered 2 warning signs for TUI that you should be aware of before investing here.
If you like to buy stocks alongside management, then you might just love this free list of companies. (Hint: insiders have been buying them).
Please note, the market returns quoted in this article reflect the market weighted average returns of stocks that currently trade on German exchanges.
Have feedback on this article? Concerned about the content? Get in touch with us directly. Alternatively, email editorial-team (at) simplywallst.com.
This article by Simply Wall St is general in nature. We provide commentary based on historical data and analyst forecasts only using an unbiased methodology and our articles are not intended to be financial advice. It does not constitute a recommendation to buy or sell any stock, and does not take account of your objectives, or your financial situation. We aim to bring you long-term focused analysis driven by fundamental data. Note that our analysis may not factor in the latest price-sensitive company announcements or qualitative material. Simply Wall St has no position in any stocks mentioned.
