Twist Bioscience (TWST) Stock: A Hidden Value Trap? Unpacking the Risks and Rewards
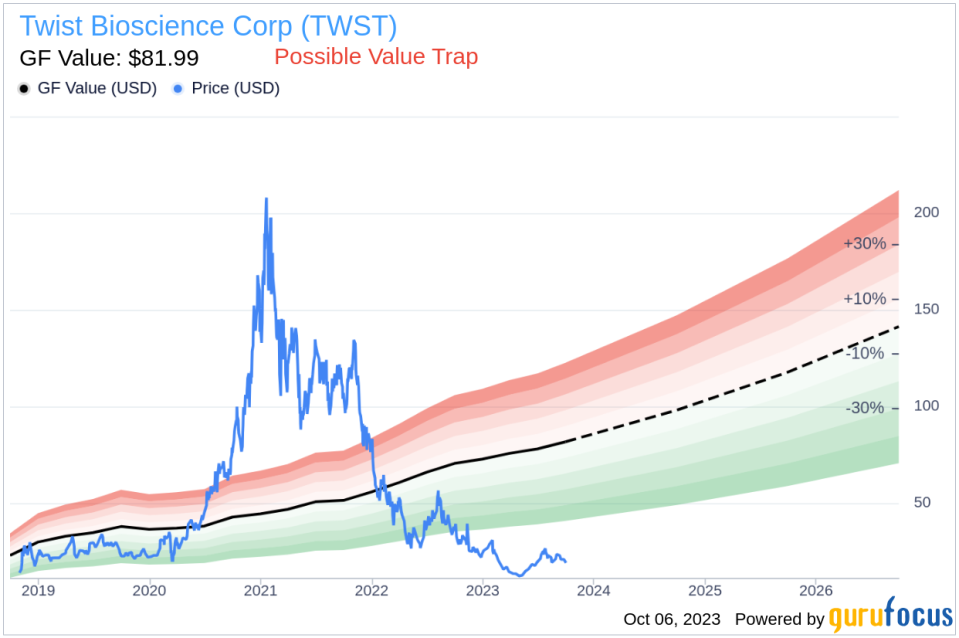
Value-focused investors are always on the hunt for stocks that are priced below their intrinsic value. One such stock that merits attention is Twist Bioscience Corp (NASDAQ:TWST). The stock, which is currently priced at 17.93, recorded a loss of 4.48% in a day and a 3-month decrease of 4.71%. The stock's fair valuation is $81.99, as indicated by its GF Value.
Understanding the GF Value
The GF Value represents the current intrinsic value of a stock derived from our exclusive method. The GF Value Line on our summary page gives an overview of the fair value that the stock should be traded at. It is calculated based on three factors: historical multiples (PE Ratio, PS Ratio, PB Ratio and Price-to-Free-Cash-Flow) that the stock has traded at, GuruFocus adjustment factor based on the company's past returns and growth, and future estimates of the business performance.
We believe the GF Value Line is the fair value that the stock should be traded at. If the stock price is significantly above the GF Value Line, it is overvalued and its future return is likely to be poor. On the other hand, if it is significantly below the GF Value Line, its future return will likely be higher.
Unpacking the Risks
However, investors need to consider a more in-depth analysis before making an investment decision. Despite its seemingly attractive valuation, certain risk factors associated with Twist Bioscience should not be ignored. These risks are primarily reflected through its low Piotroski F-score of 2. These indicators suggest that Twist Bioscience, despite its apparent undervaluation, might be a potential value trap. This complexity underlines the importance of thorough due diligence in investment decision-making.
Understanding the Piotroski F-score
The Piotroski F-score, created by accounting professor Joseph Piotroski, is a tool used to assess the strength of a company's financial health. The score is based on nine criteria that fall into three categories: profitability, leverage/liquidity/ source of funds, and operating efficiency. The overall score ranges from 0 to 9, with higher scores indicating healthier financials. Twist Bioscience's current Piotroski F-Score, however, falls in the lower end of this spectrum, indicating potential red flags for investors.
Company Overview
Twist Bioscience Corp is a synthetic biology company. It develops a disruptive DNA synthesis platform to industrialize the engineering of biology. The company's DNA synthesis platform utilizes a proprietary semiconductor-based synthetic DNA manufacturing process that synthesizes DNA on silicon instead of on traditional well-plastic plates. This enables the production of high-quality synthetic DNA faster and more affordably, overcoming inefficiencies and powering cost-effective, rapid high-throughput synthesis. This enables researchers to rapidly realize opportunities ahead. The majority of its revenue is derived from the United States.
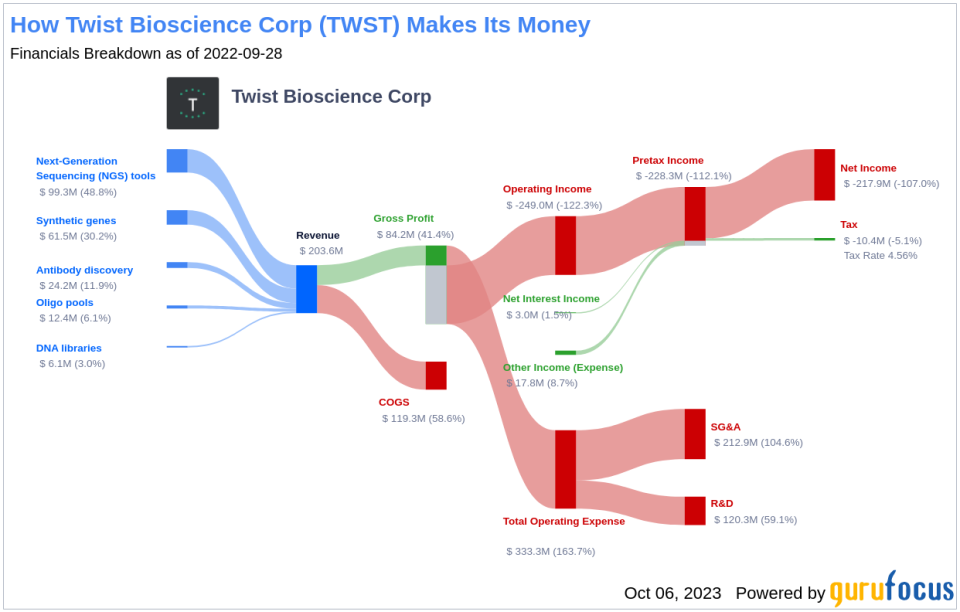
Analysis of Twist Bioscience's Profitability
Firstly, let's address profitability. One significant component of the F-Score is a positive return on assets (ROA). A closer look at Twist Bioscience's ROA reveals a worrying trend of negative returns. This indicates the company's inability to generate profit from its assets - a fundamental concern for any investor.
Observing the financials of Twist Bioscience, it's important to note that the cash flow from operations over the trailing twelve months (TTM) stands at $-123.04 million, whereas the net income in the same period is significantly higher at $-209.49 million. The Piotroski F-score considers this discrepancy as a potential red flag. If a company consistently shows lower cash flows from operations relative to its net income, it could indicate that the earnings quality is poor and the company might have difficulties sustaining its operations or financing its obligations, a fact which could negatively impact its financial stability and investor confidence.
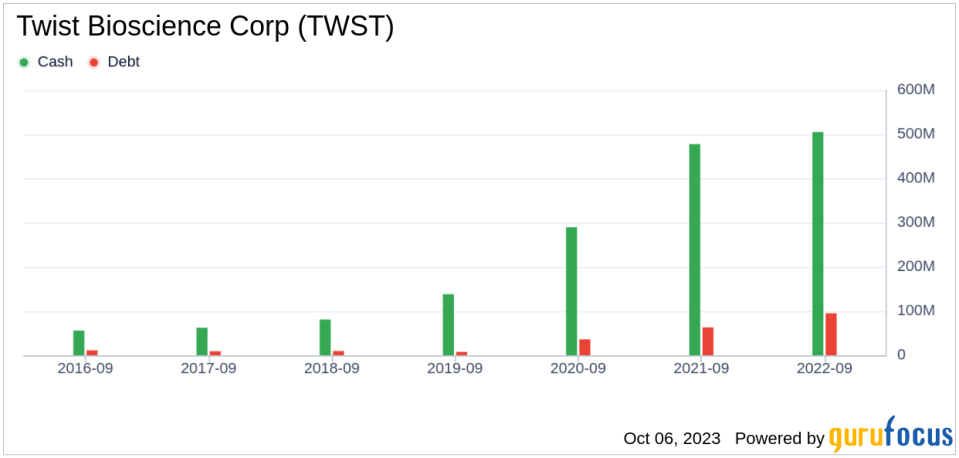
Leverage, Liquidity and Source of Funds: A Worrying Trend
Assessing the aspect of leverage, liquidity, and sources of funds, Twist Bioscience demonstrates an alarming rise in its debt-to-total assets ratio over the past three years. The data shows 2021: 0.09; 2022: 0.08; 2023: 0.12, expressed as percentages. A higher debt ratio suggests that Twist Bioscience is increasingly financing its assets through debt, thereby escalating its financial risk. The Piotroski F-Score views this as a negative indicator, further cautioning investors about Twist Bioscience.
Examining Twist Bioscience's financial stability, there's a notable decrease in its current ratio over the past three years, as shown by the data 2021: 10.52; 2022: 6.73; 2023: 6.12, which is expressed as percentages. The current ratio is a key indicator of a company's short-term financial health, as it gauges the ability to cover short-term liabilities with short-term assets. A declining current ratio suggests that Twist Bioscience's liquidity and capability to manage immediate financial obligations are deteriorating.
Operating Efficiency: A Darker Picture
Examining the data provided: 2021: 48.96; 2022: 56.29; 2023: 57.04, it becomes evident that Twist Bioscience has seen an increase in its Diluted Average Shares Outstanding over the past three years. This trend signals that the company has issued more shares. While issuing additional shares can provide immediate capital for the business, it can also lead to the dilution of existing shares' value. Consequently, if the company's earnings don't grow at a pace that matches or exceeds this share increase, it could lead to a reduction in the value perceived by existing shareholders, potentially impacting their investment returns.
In terms of operational efficiency, another key indicator, Twist Bioscience has unfortunately reported a declining trend in asset turnover over the past three years, as evidenced by the data: 2021: 0.22; 2022: 0.22; 2023: 0.26 (expressed in percentages). Asset turnover measures how effectively a company uses its assets to generate sales, and a decrease in this ratio can indicate a drop in efficiency. This could be due to various factors, such as underutilization of assets or a decline in the market demand for the company's products or services. Consequently, this downward trend in asset turnover implies that Twist Bioscience may need to revisit its operational strategies to improve the utilization of its assets and boost its sales volume.
While the Piotroski F-score is not the only lens through which to view a potential investment, it is a robust and comprehensive tool for evaluating a company's financial health. Unfortunately for Twist Bioscience, its current score suggests potential troubles.
Conclusion
Despite the apparent undervaluation of Twist Bioscience (NASDAQ:TWST) as indicated by its GF Value, the company exhibits several concerning signals. Its low Piotroski F-score, negative ROA, increasing debt ratio, declining current ratio, and deteriorating operational efficiency all point towards potential financial instability. Therefore, it appears that Twist Bioscience might indeed be a value trap. As always, thorough due diligence is recommended before making any investment decisions.
GuruFocus Premium members can find stocks with high Piotroski F-score using the following Screener: Piotroski F-score screener .
This article, generated by GuruFocus, is designed to provide general insights and is not tailored financial advice. Our commentary is rooted in historical data and analyst projections, utilizing an impartial methodology, and is not intended to serve as specific investment guidance. It does not formulate a recommendation to purchase or divest any stock and does not consider individual investment objectives or financial circumstances. Our objective is to deliver long-term, fundamental data-driven analysis. Be aware that our analysis might not incorporate the most recent, price-sensitive company announcements or qualitative information. GuruFocus holds no position in the stocks mentioned herein.
This article first appeared on GuruFocus.
