What Type Of Shareholders Own The Most Number of Hyve Group Plc (LON:HYVE) Shares?
Every investor in Hyve Group Plc (LON:HYVE) should be aware of the most powerful shareholder groups. Insiders often own a large chunk of younger, smaller, companies while huge companies tend to have institutions as shareholders. Companies that used to be publicly owned tend to have lower insider ownership.
Hyve Group is not a large company by global standards. It has a market capitalization of UK£237m, which means it wouldn't have the attention of many institutional investors. Taking a look at our data on the ownership groups (below), it seems that institutional investors have bought into the company. Let's take a closer look to see what the different types of shareholders can tell us about Hyve Group.
View our latest analysis for Hyve Group
What Does The Institutional Ownership Tell Us About Hyve Group?
Institutional investors commonly compare their own returns to the returns of a commonly followed index. So they generally do consider buying larger companies that are included in the relevant benchmark index.
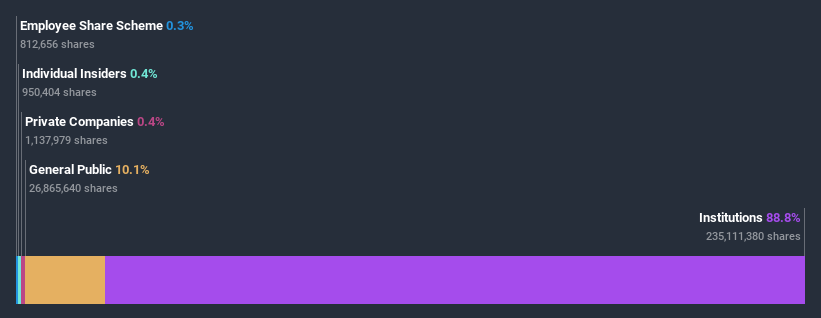
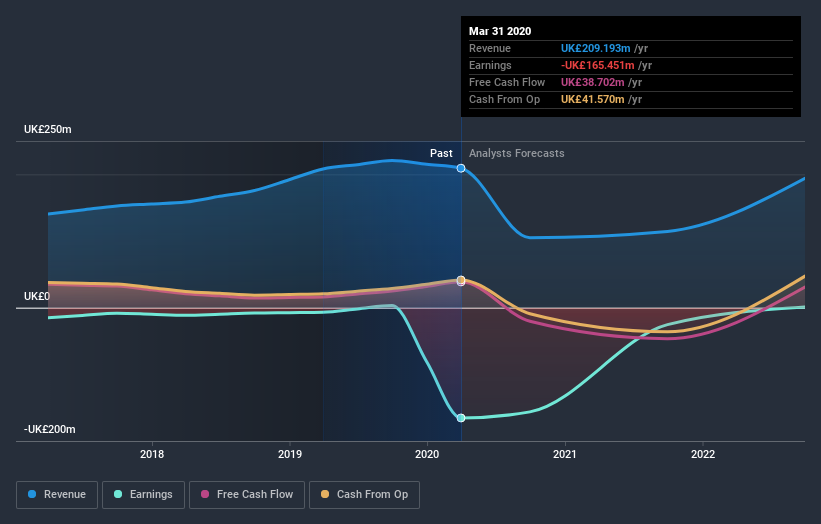
We can see that Hyve Group does have institutional investors; and they hold a good portion of the company's stock. This suggests some credibility amongst professional investors. But we can't rely on that fact alone since institutions make bad investments sometimes, just like everyone does. If multiple institutions change their view on a stock at the same time, you could see the share price drop fast. It's therefore worth looking at Hyve Group's earnings history below. Of course, the future is what really matters.
Institutional investors own over 50% of the company, so together than can probably strongly influence board decisions. Hyve Group is not owned by hedge funds. Looking at our data, we can see that the largest shareholder is RWC Partners Limited with 12% of shares outstanding. FMR LLC is the second largest shareholder owning 8.4% of common stock, and Amiral Gestion SA holds about 5.4% of the company stock.
We also observed that the top 9 shareholders account for more than half of the share register, with a few smaller shareholders to balance the interests of the larger ones to a certain extent.
While studying institutional ownership for a company can add value to your research, it is also a good practice to research analyst recommendations to get a deeper understand of a stock's expected performance. Quite a few analysts cover the stock, so you could look into forecast growth quite easily.
Insider Ownership Of Hyve Group
While the precise definition of an insider can be subjective, almost everyone considers board members to be insiders. Company management run the business, but the CEO will answer to the board, even if he or she is a member of it.
I generally consider insider ownership to be a good thing. However, on some occasions it makes it more difficult for other shareholders to hold the board accountable for decisions.
Our most recent data indicates that insiders own less than 1% of Hyve Group Plc. It has a market capitalization of just UK£237m, and the board has only UK£852k worth of shares in their own names. Many tend to prefer to see a board with bigger shareholdings. A good next step might be to take a look at this free summary of insider buying and selling.
General Public Ownership
The general public, with a 10% stake in the company, will not easily be ignored. While this size of ownership may not be enough to sway a policy decision in their favour, they can still make a collective impact on company policies.
Next Steps:
It's always worth thinking about the different groups who own shares in a company. But to understand Hyve Group better, we need to consider many other factors. Be aware that Hyve Group is showing 3 warning signs in our investment analysis , and 1 of those is concerning...
Ultimately the future is most important. You can access this free report on analyst forecasts for the company.
NB: Figures in this article are calculated using data from the last twelve months, which refer to the 12-month period ending on the last date of the month the financial statement is dated. This may not be consistent with full year annual report figures.
This article by Simply Wall St is general in nature. It does not constitute a recommendation to buy or sell any stock, and does not take account of your objectives, or your financial situation. We aim to bring you long-term focused analysis driven by fundamental data. Note that our analysis may not factor in the latest price-sensitive company announcements or qualitative material. Simply Wall St has no position in any stocks mentioned.
Have feedback on this article? Concerned about the content? Get in touch with us directly. Alternatively, email editorial-team@simplywallst.com.
