What Type Of Shareholders Own The Most Number of Nova Ltd. (NASDAQ:NVMI) Shares?
The big shareholder groups in Nova Ltd. (NASDAQ:NVMI) have power over the company. Institutions will often hold stock in bigger companies, and we expect to see insiders owning a noticeable percentage of the smaller ones. We also tend to see lower insider ownership in companies that were previously publicly owned.
Nova isn't enormous, but it's not particularly small either. It has a market capitalization of US$2.8b, which means it would generally expect to see some institutions on the share registry. In the chart below, we can see that institutional investors have bought into the company. We can zoom in on the different ownership groups, to learn more about Nova.
Check out our latest analysis for Nova
What Does The Institutional Ownership Tell Us About Nova?
Many institutions measure their performance against an index that approximates the local market. So they usually pay more attention to companies that are included in major indices.
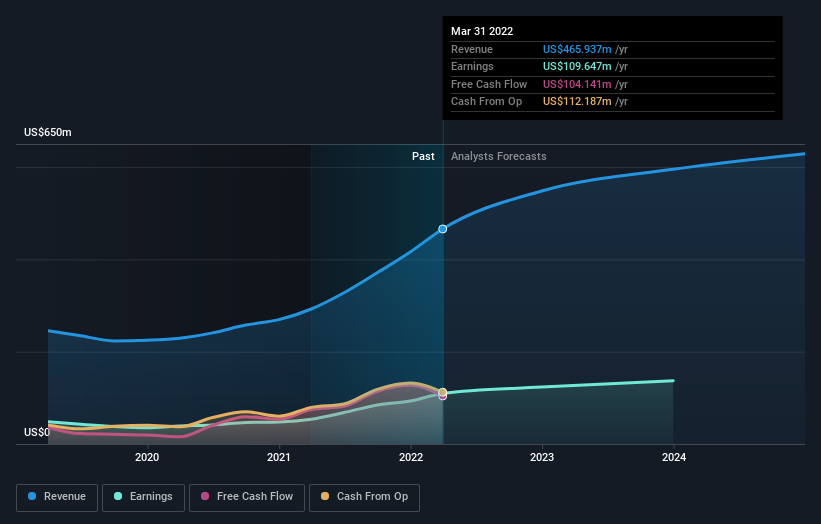
We can see that Nova does have institutional investors; and they hold a good portion of the company's stock. This suggests some credibility amongst professional investors. But we can't rely on that fact alone since institutions make bad investments sometimes, just like everyone does. When multiple institutions own a stock, there's always a risk that they are in a 'crowded trade'. When such a trade goes wrong, multiple parties may compete to sell stock fast. This risk is higher in a company without a history of growth. You can see Nova's historic earnings and revenue below, but keep in mind there's always more to the story.
Investors should note that institutions actually own more than half the company, so they can collectively wield significant power. Hedge funds don't have many shares in Nova. The company's largest shareholder is Wasatch Advisors Inc, with ownership of 7.8%. With 5.7% and 4.2% of the shares outstanding respectively, FMR LLC and Harel Insurance Investments and Finances Services Ltd, Asset Management Arm are the second and third largest shareholders.
Looking at the shareholder registry, we can see that 50% of the ownership is controlled by the top 17 shareholders, meaning that no single shareholder has a majority interest in the ownership.
While it makes sense to study institutional ownership data for a company, it also makes sense to study analyst sentiments to know which way the wind is blowing. Quite a few analysts cover the stock, so you could look into forecast growth quite easily.
Insider Ownership Of Nova
The definition of an insider can differ slightly between different countries, but members of the board of directors always count. Company management run the business, but the CEO will answer to the board, even if he or she is a member of it.
Most consider insider ownership a positive because it can indicate the board is well aligned with other shareholders. However, on some occasions too much power is concentrated within this group.
Our data cannot confirm that board members are holding shares personally. It is unusual not to have at least some personal holdings by board members, so our data might be flawed. A good next step would be to check how much the CEO is paid.
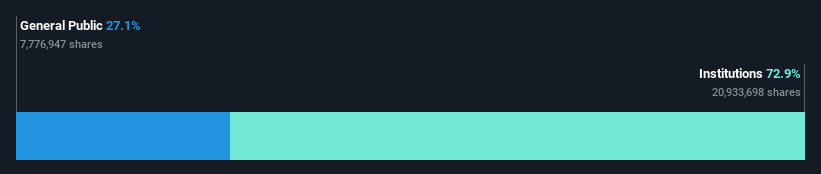
General Public Ownership
The general public, who are usually individual investors, hold a 27% stake in Nova. While this group can't necessarily call the shots, it can certainly have a real influence on how the company is run.
Next Steps:
I find it very interesting to look at who exactly owns a company. But to truly gain insight, we need to consider other information, too.
I always like to check for a history of revenue growth. You can too, by accessing this free chart of historic revenue and earnings in this detailed graph.
If you are like me, you may want to think about whether this company will grow or shrink. Luckily, you can check this free report showing analyst forecasts for its future.
NB: Figures in this article are calculated using data from the last twelve months, which refer to the 12-month period ending on the last date of the month the financial statement is dated. This may not be consistent with full year annual report figures.
Have feedback on this article? Concerned about the content? Get in touch with us directly. Alternatively, email editorial-team (at) simplywallst.com.
This article by Simply Wall St is general in nature. We provide commentary based on historical data and analyst forecasts only using an unbiased methodology and our articles are not intended to be financial advice. It does not constitute a recommendation to buy or sell any stock, and does not take account of your objectives, or your financial situation. We aim to bring you long-term focused analysis driven by fundamental data. Note that our analysis may not factor in the latest price-sensitive company announcements or qualitative material. Simply Wall St has no position in any stocks mentioned.
