U.S. Physical Therapy (NYSE:USPH) shareholders notch a 16% CAGR over 3 years, yet earnings have been shrinking
By buying an index fund, you can roughly match the market return with ease. But many of us dare to dream of bigger returns, and build a portfolio ourselves. For example, U.S. Physical Therapy, Inc. (NYSE:USPH) shareholders have seen the share price rise 51% over three years, well in excess of the market return (36%, not including dividends). However, more recent returns haven't been as impressive as that, with the stock returning just 11% in the last year , including dividends .
The past week has proven to be lucrative for U.S. Physical Therapy investors, so let's see if fundamentals drove the company's three-year performance.
View our latest analysis for U.S. Physical Therapy
To quote Buffett, 'Ships will sail around the world but the Flat Earth Society will flourish. There will continue to be wide discrepancies between price and value in the marketplace...' By comparing earnings per share (EPS) and share price changes over time, we can get a feel for how investor attitudes to a company have morphed over time.
During the three years of share price growth, U.S. Physical Therapy actually saw its earnings per share (EPS) drop 5.5% per year.
This means it's unlikely the market is judging the company based on earnings growth. Given this situation, it makes sense to look at other metrics too.
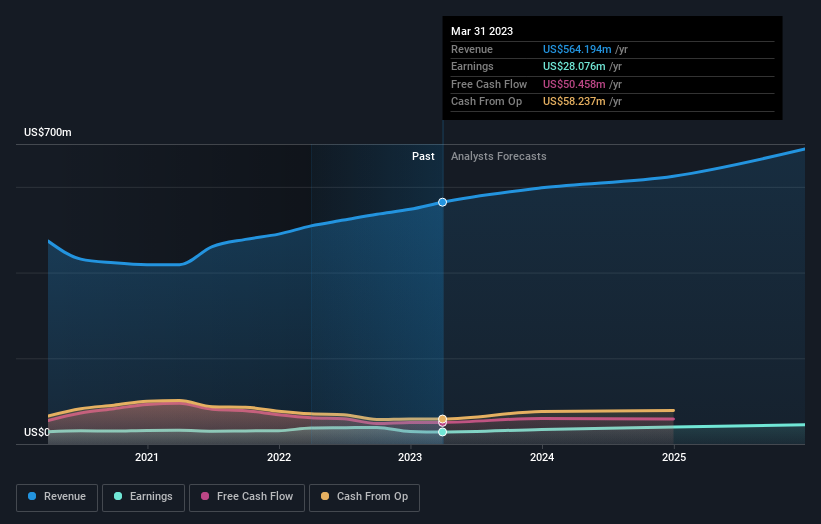
The modest 1.5% dividend yield is unlikely to be propping up the share price. It may well be that U.S. Physical Therapy revenue growth rate of 9.6% over three years has convinced shareholders to believe in a brighter future. If the company is being managed for the long term good, today's shareholders might be right to hold on.
You can see below how earnings and revenue have changed over time (discover the exact values by clicking on the image).
We consider it positive that insiders have made significant purchases in the last year. Having said that, most people consider earnings and revenue growth trends to be a more meaningful guide to the business. So it makes a lot of sense to check out what analysts think U.S. Physical Therapy will earn in the future (free profit forecasts).
What About Dividends?
It is important to consider the total shareholder return, as well as the share price return, for any given stock. The TSR incorporates the value of any spin-offs or discounted capital raisings, along with any dividends, based on the assumption that the dividends are reinvested. So for companies that pay a generous dividend, the TSR is often a lot higher than the share price return. We note that for U.S. Physical Therapy the TSR over the last 3 years was 57%, which is better than the share price return mentioned above. This is largely a result of its dividend payments!
A Different Perspective
U.S. Physical Therapy shareholders gained a total return of 11% during the year. But that was short of the market average. On the bright side, that's still a gain, and it's actually better than the average return of 4% over half a decade This could indicate that the company is winning over new investors, as it pursues its strategy. While it is well worth considering the different impacts that market conditions can have on the share price, there are other factors that are even more important. Consider for instance, the ever-present spectre of investment risk. We've identified 2 warning signs with U.S. Physical Therapy , and understanding them should be part of your investment process.
If you like to buy stocks alongside management, then you might just love this free list of companies. (Hint: insiders have been buying them).
Please note, the market returns quoted in this article reflect the market weighted average returns of stocks that currently trade on American exchanges.
Have feedback on this article? Concerned about the content? Get in touch with us directly. Alternatively, email editorial-team (at) simplywallst.com.
This article by Simply Wall St is general in nature. We provide commentary based on historical data and analyst forecasts only using an unbiased methodology and our articles are not intended to be financial advice. It does not constitute a recommendation to buy or sell any stock, and does not take account of your objectives, or your financial situation. We aim to bring you long-term focused analysis driven by fundamental data. Note that our analysis may not factor in the latest price-sensitive company announcements or qualitative material. Simply Wall St has no position in any stocks mentioned.
Join A Paid User Research Session
You’ll receive a US$30 Amazon Gift card for 1 hour of your time while helping us build better investing tools for the individual investors like yourself. Sign up here
