UFP Industries, Inc.'s (NASDAQ:UFPI) Fundamentals Look Pretty Strong: Could The Market Be Wrong About The Stock?
With its stock down 22% over the past three months, it is easy to disregard UFP Industries (NASDAQ:UFPI). However, a closer look at its sound financials might cause you to think again. Given that fundamentals usually drive long-term market outcomes, the company is worth looking at. Specifically, we decided to study UFP Industries' ROE in this article.
ROE or return on equity is a useful tool to assess how effectively a company can generate returns on the investment it received from its shareholders. Simply put, it is used to assess the profitability of a company in relation to its equity capital.
Check out our latest analysis for UFP Industries
How Is ROE Calculated?
The formula for return on equity is:
Return on Equity = Net Profit (from continuing operations) ÷ Shareholders' Equity
So, based on the above formula, the ROE for UFP Industries is:
29% = US$720m ÷ US$2.5b (Based on the trailing twelve months to September 2022).
The 'return' is the income the business earned over the last year. That means that for every $1 worth of shareholders' equity, the company generated $0.29 in profit.
What Is The Relationship Between ROE And Earnings Growth?
We have already established that ROE serves as an efficient profit-generating gauge for a company's future earnings. Based on how much of its profits the company chooses to reinvest or "retain", we are then able to evaluate a company's future ability to generate profits. Generally speaking, other things being equal, firms with a high return on equity and profit retention, have a higher growth rate than firms that don’t share these attributes.
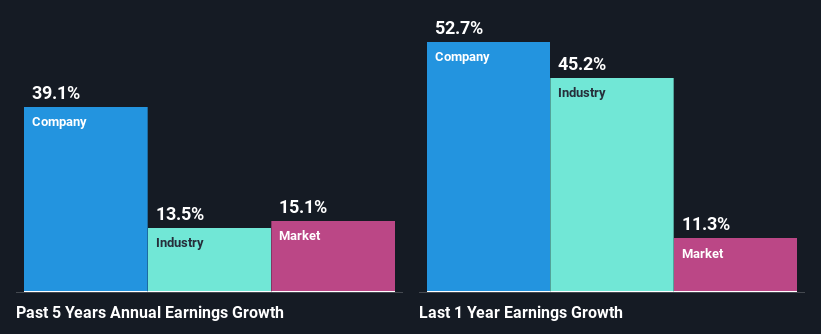
A Side By Side comparison of UFP Industries' Earnings Growth And 29% ROE
First thing first, we like that UFP Industries has an impressive ROE. Secondly, even when compared to the industry average of 22% the company's ROE is quite impressive. Under the circumstances, UFP Industries' considerable five year net income growth of 39% was to be expected.
Next, on comparing with the industry net income growth, we found that UFP Industries' growth is quite high when compared to the industry average growth of 14% in the same period, which is great to see.
The basis for attaching value to a company is, to a great extent, tied to its earnings growth. What investors need to determine next is if the expected earnings growth, or the lack of it, is already built into the share price. By doing so, they will have an idea if the stock is headed into clear blue waters or if swampy waters await. Has the market priced in the future outlook for UFPI? You can find out in our latest intrinsic value infographic research report.
Is UFP Industries Using Its Retained Earnings Effectively?
UFP Industries has a really low three-year median payout ratio of 10%, meaning that it has the remaining 90% left over to reinvest into its business. So it looks like UFP Industries is reinvesting profits heavily to grow its business, which shows in its earnings growth.
Additionally, UFP Industries has paid dividends over a period of at least ten years which means that the company is pretty serious about sharing its profits with shareholders.
Conclusion
On the whole, we feel that UFP Industries' performance has been quite good. Particularly, we like that the company is reinvesting heavily into its business, and at a high rate of return. Unsurprisingly, this has led to an impressive earnings growth. Having said that, on studying current analyst estimates, we were concerned to see that while the company has grown its earnings in the past, analysts expect its earnings to shrink in the future. Are these analysts expectations based on the broad expectations for the industry, or on the company's fundamentals? Click here to be taken to our analyst's forecasts page for the company.
Have feedback on this article? Concerned about the content? Get in touch with us directly. Alternatively, email editorial-team (at) simplywallst.com.
This article by Simply Wall St is general in nature. We provide commentary based on historical data and analyst forecasts only using an unbiased methodology and our articles are not intended to be financial advice. It does not constitute a recommendation to buy or sell any stock, and does not take account of your objectives, or your financial situation. We aim to bring you long-term focused analysis driven by fundamental data. Note that our analysis may not factor in the latest price-sensitive company announcements or qualitative material. Simply Wall St has no position in any stocks mentioned.
Join A Paid User Research Session
You’ll receive a US$30 Amazon Gift card for 1 hour of your time while helping us build better investing tools for the individual investors like yourself. Sign up here
