Is Ultragenyx Pharmaceutical (RARE) Too Good to Be True? A Comprehensive Analysis of a ...
Value-focused investors are always on the hunt for stocks that are priced below their intrinsic value. One such stock that merits attention is Ultragenyx Pharmaceutical Inc (NASDAQ:RARE). The stock, which is currently priced at $40.42, recorded a gain of 4.19% in a day and a 3-month decrease of 22.86%. The stock's fair valuation is $80.51, as indicated by its GF Value.
Understanding GF Value
The GF Value represents the current intrinsic value of a stock derived from our exclusive method. The GF Value Line on our summary page gives an overview of the fair value that the stock should be traded at. It is calculated based on three factors: historical multiples (PE Ratio, PS Ratio, PB Ratio and Price-to-Free-Cash-Flow) that the stock has traded at, GuruFocus adjustment factor based on the company's past returns and growth, and future estimates of the business performance.
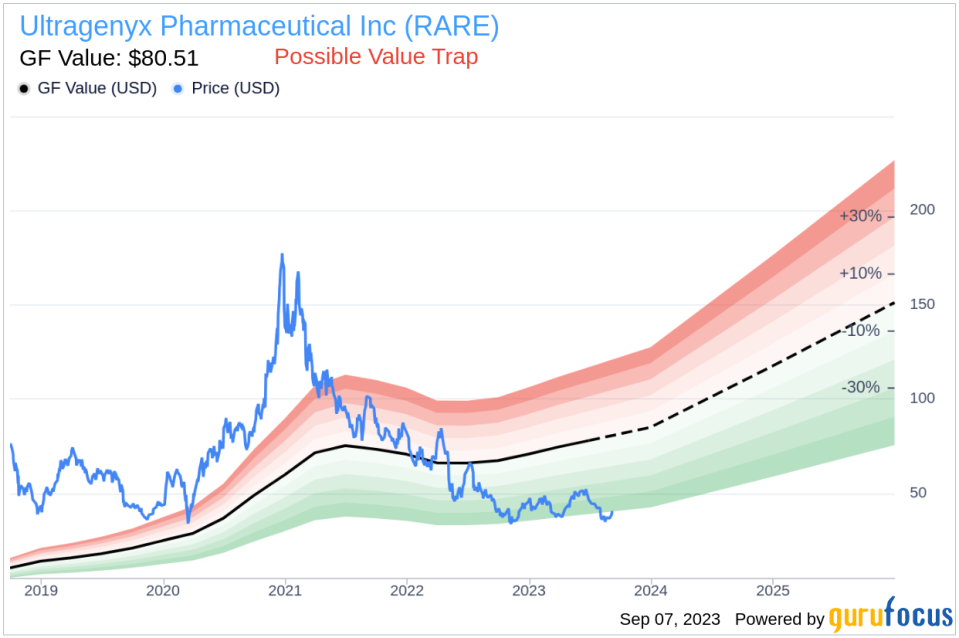
However, investors need to consider a more in-depth analysis before making an investment decision. Despite its seemingly attractive valuation, certain risk factors associated with Ultragenyx Pharmaceutical should not be ignored. These risks are primarily reflected through its low Altman Z-score of -2.83. These indicators suggest that Ultragenyx Pharmaceutical, despite its apparent undervaluation, might be a potential value trap. This complexity underlines the importance of thorough due diligence in investment decision-making.
Altman Z-Score: A Risk Indicator
Before delving into the details, let's understand what the Altman Z-score entails. Invented by New York University Professor Edward I. Altman in 1968, the Z-Score is a financial model that predicts the probability of a company entering bankruptcy within a two-year time frame. The Altman Z-Score combines five different financial ratios, each weighted to create a final score. A score below 1.8 suggests a high likelihood of financial distress, while a score above 3 indicates a low risk.
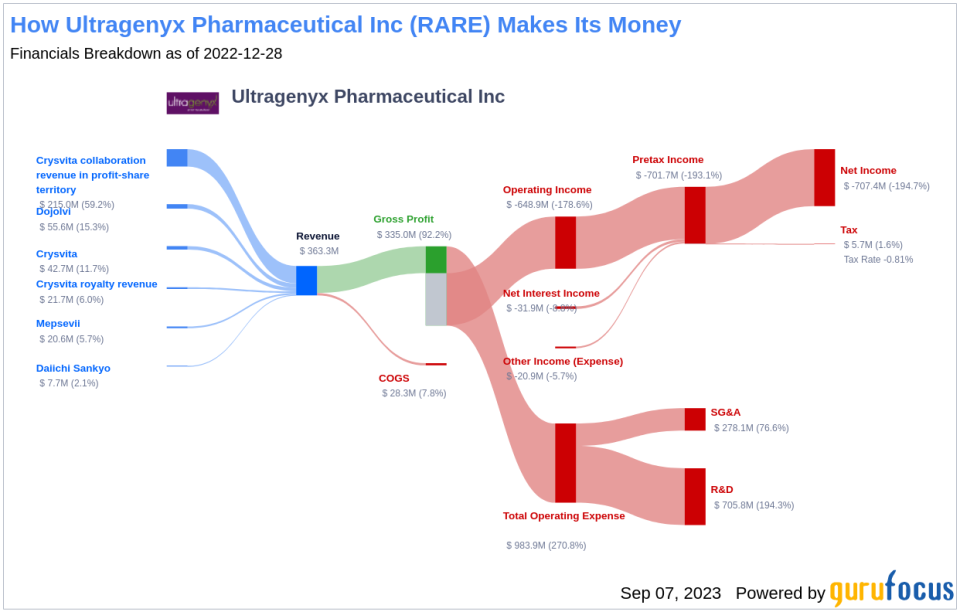
Company Overview: Ultragenyx Pharmaceutical Inc (NASDAQ:RARE)
Ultragenyx Pharmaceutical Inc is a USA-based biopharmaceutical company. It identifies, acquires, develops, and commercializes novel products for the treatment of serious rare and ultra-rare diseases, with a focus on serious, debilitating genetic diseases. The company's medicine portfolio includes Crysvita, Dojolvi, and Mepsevii. Crysvita is indicated for the treatment of X-linked hypophosphatemia (XLH) in adult and pediatric patients 1 year of age and older. Mepsevii is indicated in pediatric and adult patients for the treatment of Mucopolysaccharidosis VII.
Ultragenyx Pharmaceutical's Low Altman Z-Score: A Breakdown of Key Drivers
A dissection of Ultragenyx Pharmaceutical's Altman Z-score reveals Ultragenyx Pharmaceutical's financial health may be weak, suggesting possible financial distress. The Retained Earnings to Total Assets ratio provides insights into a company's capability to reinvest its profits or manage debt. Evaluating Ultragenyx Pharmaceutical's historical data, 2021: -1.24; 2022: -1.81; 2023: -2.37, we observe a declining trend in this ratio. This downward movement indicates Ultragenyx Pharmaceutical's diminishing ability to reinvest in its business or effectively manage its debt. Consequently, it exerts a negative impact on its Z-Score.
The EBIT to Total Assets ratio serves as a crucial barometer of a company's operational effectiveness, correlating earnings before interest and taxes (EBIT) to total assets. An analysis of Ultragenyx Pharmaceutical's EBIT to Total Assets ratio from historical data (2021: -0.21; 2022: -0.36; 2023: -0.50) indicates a descending trend. This reduction suggests that Ultragenyx Pharmaceutical might not be utilizing its assets to their full potential to generate operational profits, which could be negatively affecting the company's overall Z-score.
When it comes to operational efficiency, a vital indicator for Ultragenyx Pharmaceutical is its asset turnover. The data: 2021: 0.24; 2022: 0.23; 2023: 0.28 from the past three years suggests a recent decline following an initial increase in this ratio. The asset turnover ratio reflects how effectively a company is using its assets to generate sales. Therefore, a drop in this ratio can signify reduced operational efficiency, potentially due to underutilization of assets or decreased market demand for the company's products or services. This shift in Ultragenyx Pharmaceutical's asset turnover underlines the need for the company to reassess its operational strategies to optimize asset usage and boost sales.
Conclusion: Navigating the Thin Line Between Value and Trap
While Ultragenyx Pharmaceutical (NASDAQ:RARE) may seem an attractive investment due to its current price below the GF Value, the low Altman Z-score and declining ratios suggest potential financial distress. These factors indicate that Ultragenyx Pharmaceutical could be a value trap. Therefore, investors should exercise caution and conduct thorough due diligence before making an investment decision.
GuruFocus Premium members can find stocks with high Altman Z-Score using the following Screener: Walter Schloss Screen .
This article first appeared on GuruFocus.
