Under Armour Inc (UAA): A Deep Dive into Its Performance Potential
Long-established in the Manufacturing - Apparel & Accessories industry, Under Armour Inc (NYSE:UAA) has enjoyed a stellar reputation. It has recently witnessed a daily gain of 5.42%, juxtaposed with a three-month change of -3.78%. However, fresh insights from the GF Score hint at potential headwinds. Notably, its diminished rankings in financial strength, growth, and valuation suggest that the company might not live up to its historical performance. Join us as we dive deep into these pivotal metrics to unravel the evolving narrative of Under Armour Inc.

Understanding the GF Score
The GF Score is a stock performance ranking system developed by GuruFocus using five aspects of valuation, which has been found to be closely correlated to the long-term performances of stocks by backtesting from 2006 to 2021. The stocks with a higher GF Score generally generate higher returns than those with a lower GF Score. Therefore, when picking stocks, investors should invest in companies with high GF Scores. The GF Score ranges from 0 to 100, with 100 as the highest rank.
Financial strength rank: 7/10
Profitability rank: 5/10
Growth rank: 0/10
GF Value rank: 4/10
Momentum rank: 5/10
Based on the above method, GuruFocus assigned Under Armour Inc the GF Score of 62 out of 100, which signals poor future outperformance potential.
Under Armour Inc: A Snapshot of the Business
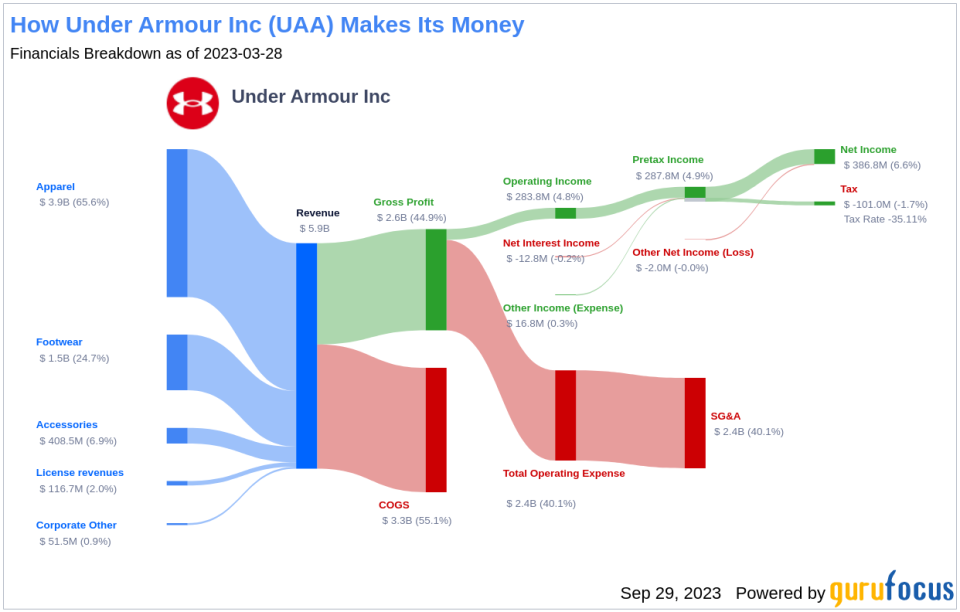
Under Armour Inc, with a market cap of $2.97 billion, develops, markets, and distributes athletic apparel, footwear, and accessories in North America, Asia-Pacific, Europe, and other regions. The company, founded in 1996, caters to professional and amateur athletes, sponsored college and professional teams, and people with active lifestyles. It sells merchandise through direct-to-consumer, including e-commerce and more than 400 combined factory house and brand house stores, and wholesale channels. Under Armour also operates a digital fitness app called MapMyFitness.
Profitability Concerns
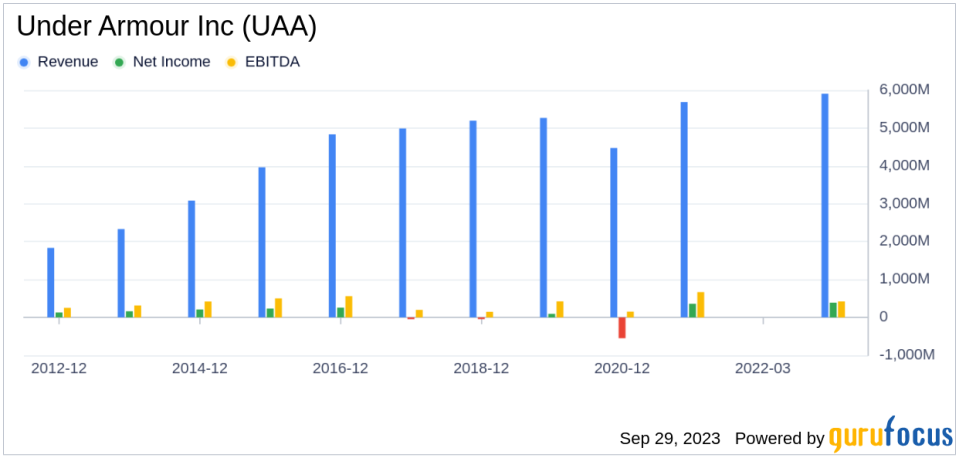
Under Armour Inc's low Profitability rank can raise warning signals. The company's Gross Margin has also declined over the past five years, as evidenced by the data: 2019: 46.90; 2020: 48.27; 2021: 50.35; 2022: 0; 2023: 44.88. This trend underscores the company's struggles to convert its revenue into profits.
Growth Prospects
A lack of significant growth is another area where Under Armour Inc seems to falter, as evidenced by the company's low Growth rank. Furthermore, Under Armour Inc's predictability rank is just one star out of five, adding to investor uncertainty regarding revenue and earnings consistency.
Conclusion
Given the company's financial strength, profitability, and growth metrics, the GF Score highlights Under Armour Inc's potential for underperformance. While the company has a strong reputation in the industry, these metrics suggest that it may struggle to maintain its historical performance. Investors should consider these factors when making investment decisions.
GuruFocus Premium members can find more companies with strong GF Scores using the following screener link: GF Score Screen
This article first appeared on GuruFocus.
