Under Armour (UAA): A Hidden Gem or a Falling Star? An In-depth Analysis of Its Valuation
Under Armour Inc (NYSE:UAA) witnessed a daily gain of 5.8%, despite a 3-month loss of 8.13%. With an Earnings Per Share (EPS) of 0.86, the question arises: is the stock significantly undervalued? This article provides a comprehensive valuation analysis of Under Armour (NYSE:UAA). So, let's delve into the details.
Company Overview
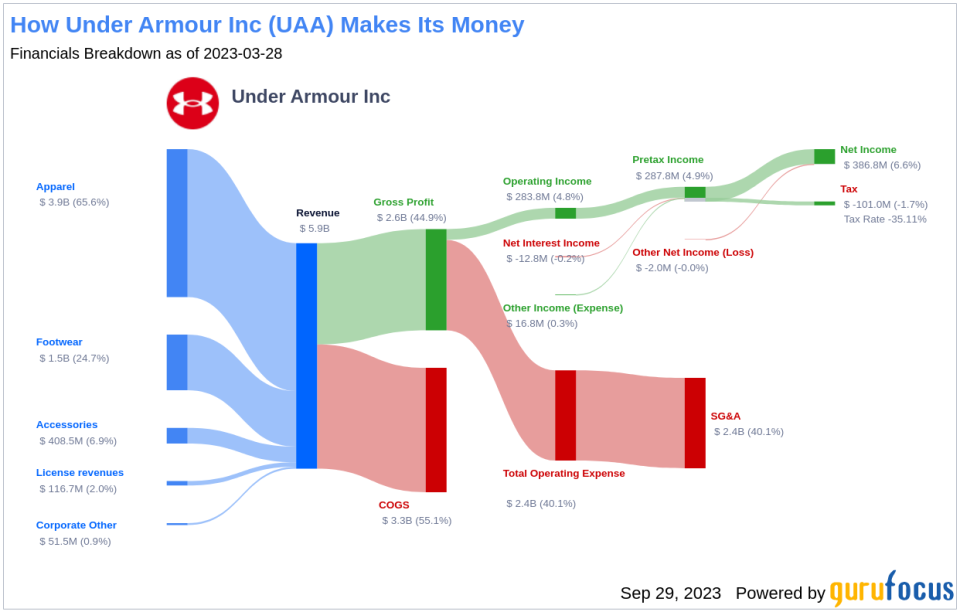
Under Armour Inc (NYSE:UAA), founded in 1996, is a Baltimore-based company that develops, markets, and distributes athletic apparel, footwear, and accessories. The company operates in North America, Asia-Pacific, Europe, and other regions. Its performance-based clothing and shoes are popular among professional and amateur athletes, sponsored college and professional teams, and people with active lifestyles. Under Armour sells merchandise through direct-to-consumer, including e-commerce and over 400 combined factory house and brand house stores, and wholesale channels. The company also operates a digital fitness app called MapMyFitness.
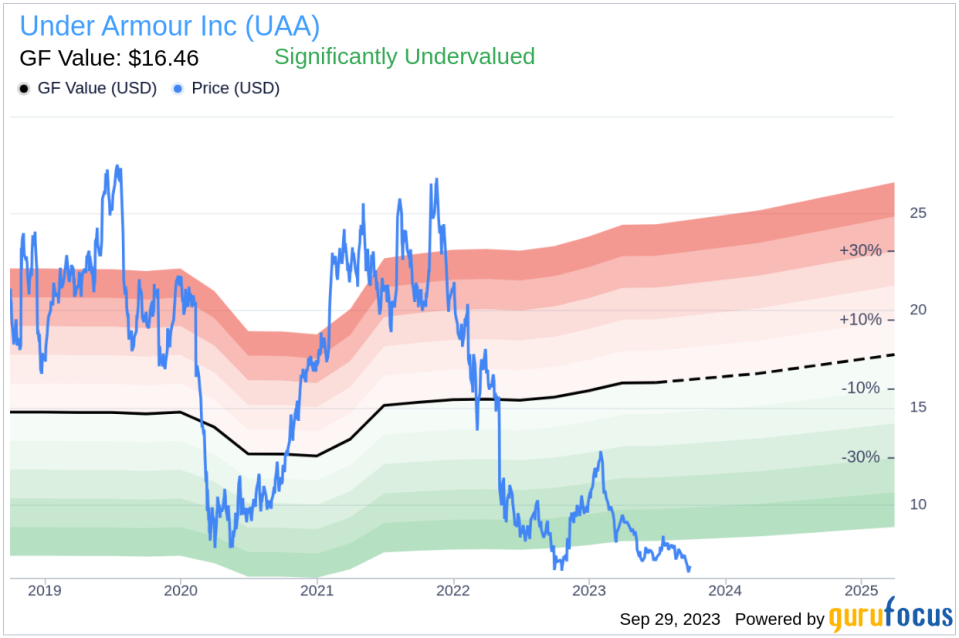
Currently, Under Armour (NYSE:UAA) is trading at $6.93 per share, significantly lower than its fair value (GF Value) of $16.46. With a market cap of $3 billion and sales of $5.90 billion, is the stock really undervalued?
Understanding GF Value
The GF Value is a proprietary measure that represents the intrinsic value of a stock. It is calculated based on historical trading multiples, a GuruFocus adjustment factor based on past returns and growth, and future business performance estimates. The GF Value Line represents the fair trading value of the stock. If the stock price is significantly above the GF Value Line, it is overvalued and its future return is likely to be poor. Conversely, if it is significantly below the GF Value Line, its future return will likely be higher.
Based on the GF Value calculation, Under Armour (NYSE:UAA) appears to be significantly undervalued. Given this undervaluation, the long-term return of its stock is likely to be much higher than its business growth.
Link: These companies may deliver higher future returns at reduced risk.
Examining Financial Strength
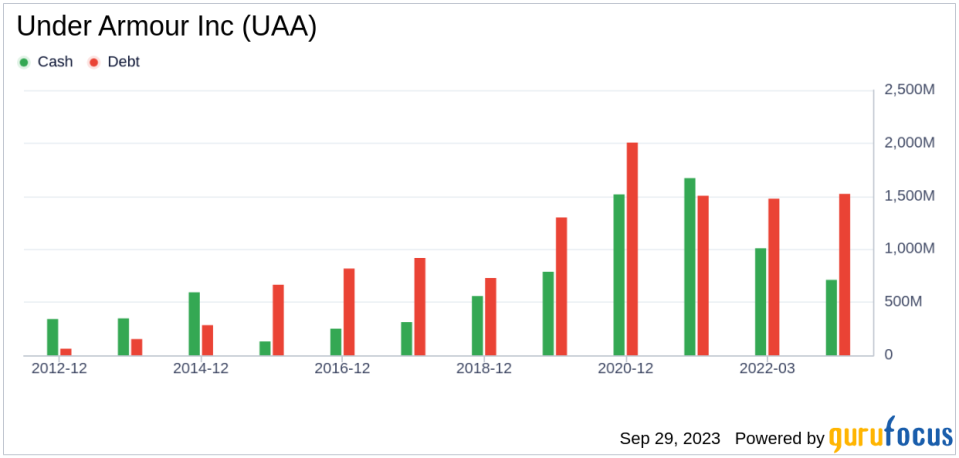
Companies with poor financial strength pose a high risk of permanent capital loss for investors. To avoid this, it's crucial to review a company's financial strength before deciding to purchase shares. Key indicators of financial strength include the cash-to-debt ratio and interest coverage. Under Armour has a cash-to-debt ratio of 0.47, ranking worse than 50.3% of 994 companies in the Manufacturing - Apparel & Accessories industry. The overall financial strength of Under Armour is 7 out of 10, indicating fair financial strength.
Profitability and Growth
Companies that are consistently profitable over the long term offer less risk to investors. Higher profit margins usually indicate a better investment compared to a company with lower profit margins. Under Armour has been profitable 6 out of the past 10 years. Over the past twelve months, the company had a revenue of $5.90 billion and Earnings Per Share (EPS) of $0.86. Its operating margin is 4.6%, ranking better than 54.45% of 1056 companies in the Manufacturing - Apparel & Accessories industry. Overall, the profitability of Under Armour is ranked 5 out of 10, indicating fair profitability.
Growth is a crucial factor in the valuation of a company. The faster a company is growing, the more likely it is to be creating value for shareholders, especially if the growth is profitable. The 3-year average annual revenue growth rate of Under Armour is 9.1%, ranking better than 68.69% of 1019 companies in the Manufacturing - Apparel & Accessories industry. The 3-year average EBITDA growth rate is 39.4%, ranking better than 83.68% of 864 companies in the same industry.
ROIC vs WACC
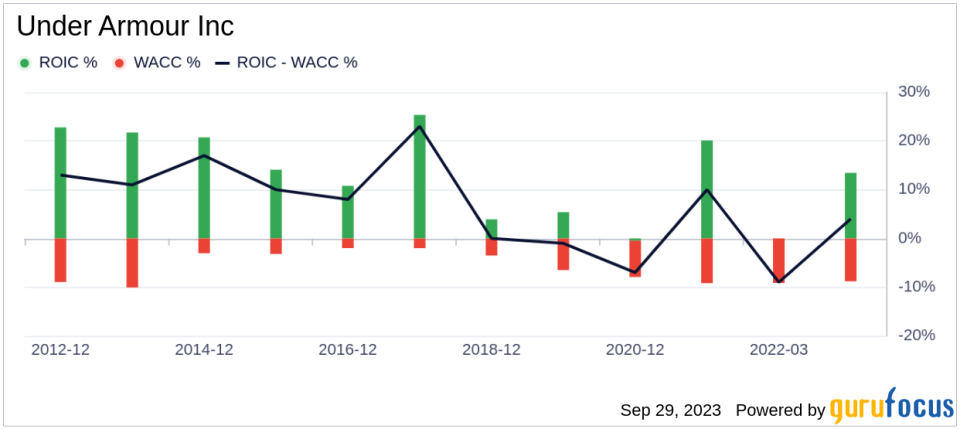
Another way to assess the profitability of a company is to compare its Return on Invested Capital (ROIC) and the Weighted Average Cost of Capital (WACC). ROIC measures how well a company generates cash flow relative to the capital it has invested in its business. WACC is the rate that a company is expected to pay on average to all its security holders to finance its assets. Ideally, ROIC should be higher than WACC. For the past 12 months, Under Armour's ROIC is 12.72, and its WACC is 9.4.
Conclusion
Overall, Under Armour (NYSE:UAA) stock appears to be significantly undervalued. The company's financial condition is fair, and its profitability is also fair. Its growth ranks better than 83.68% of 864 companies in the Manufacturing - Apparel & Accessories industry. To learn more about Under Armour stock, you can check out its 30-Year Financials here.
To find out the high-quality companies that may deliver above-average returns, please check out GuruFocus High Quality Low Capex Screener.
This article first appeared on GuruFocus.
