United Rentals (URI) Q2 Earnings & Revenues Top, '23 View Up
United Rentals, Inc.’s URI second-quarter 2023 earnings and revenues surpassed the Zacks Consensus Estimate. On a year-over-year basis, earnings and revenues increased courtesy of sustained demand in its end markets and the strength of its core rental business.
Moreover, URI has lifted its guidance for 2023, given the strength of the present market condition and the multi-year tailwinds the company sees across infrastructure, manufacturing, and energy and power.
However, shares dropped 3.6% in the after-hours trading session on Jul 26, following second-quarter 2023 results. Most likely, investors were less optimistic after the Fed policymakers raised their main interest rate by a quarter-point to a 5.25%-5.5% target range yesterday.
Also, it unveiled a quarterly dividend of $1.48 per share, with an annualized yield of approximately 1.3%. The company also repurchased $500 million of stock year to date under its existing $1.25 billion share repurchase program.
Inside the Headlines
Adjusted earnings of 9.88 per share surpassed the Zacks Consensus Estimate of $9.23 by 7%. The reported figure increased by 25.7% from the prior-year figure of $7.86 per share.
United Rentals, Inc. Price, Consensus and EPS Surprise
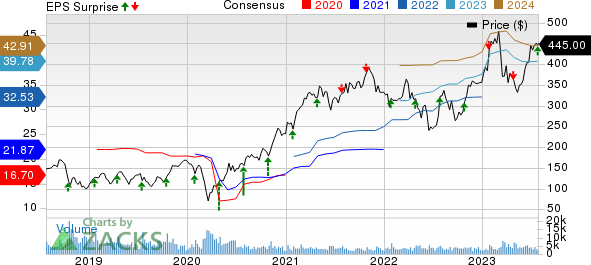
United Rentals, Inc. price-consensus-eps-surprise-chart | United Rentals, Inc. Quote
Total revenues of $3.55 billion surpassed the consensus mark of $3.43 billion by 3.5% and grew 28.3% year over year.
Rental revenues increased 21.1% from the year-ago quarter to $2.98 billion. This upside was mainly attributable to broad-based demand growth across end markets served by the company. Also, Ahern Rentals buyout contributed to the growth. However, fleet productivity was down 2%, but average original equipment costs increased by 25.5% year over year.
Used equipment sales rose 132.9% from a year ago. The Used equipment sales produced an adjusted gross margin of 57.3%, which contracted 490 basis points (bps). This downside was due to the expected normalization of channel mix, including the expanded use of wholesale channels, and the impact of sales of equipment acquired in the Ahern Rentals acquisition.
Segment Discussion
General Rentals: This segment registered 22.5% year-over-year growth in rental revenues to $2.19 billion. Rental gross margin contracted 270 bps year over year to 36% due to the impact of the Ahern Rentals acquisition.
Specialty: Segmental rental revenues increased 17.3% year over year to $792 million. Rentals’ gross margin expanded 240 bps on a year-over-year basis to 48.6%. This was backed by better cost performance and fixed cost absorption on higher revenues.
Margins
The company’s total equipment rentals’ gross margin grew 20 bps year over year to 39.3% on a pro forma basis. Adjusted EBITDA for the reported period grew 29.3% year over year to $1.7 billion. Adjusted EBITDA margin also increased 40 bps to 47.7%.
Balance Sheet
United Rentals had cash and cash equivalents of $227 million as of Jun 30, 2023, up from $106 million at 2022-end. Total liquidity was $2.706 billion at June-end. Long-term debt at the second-quarter end was $10.49 billion, down from $11.21 billion at 2022-end.
On Jun 30, 2023, the net leverage ratio was 1.8x compared to 2.0x on Dec 31, 2022. Return on invested capital increased 190 bps year over year and 30 bps sequentially to a record 13.4% for the trailing 12 months that ended Jun 30, 2023.
Cash from operating activities improved 11.7% year over year to $1.29 million in the second quarter. Free cash flow, including merger and restructuring-related payments, dropped 13.3% year over year to $340 million for the quarter due to higher net rental capital expenditures.
2023 Guidance Raised
Total revenues are expected to be in the range of $14-$14.3 billion versus $13.7-$14.2 billion projected earlier. Adjusted EBITDA is projected to be between $6.75 billion and $6.9 billion compared with the prior projection of $6.6-$6.85 billion.
Net rental capital expenditure after gross purchases is projected within $1.9-$2.1 billion (versus the prior expectation of $2-$2.25 billion), indicating a decrease from $2.471 billion in 2022.
Net cash provided by operating activities is anticipated to be in the range of $4.5-$4.8 billion (compared with $4.4-$4.8 billion expected earlier), suggesting a rise from $4.433 billion in 2022.
Free cash flow (excluding the impact of merger and restructuring-related payments) is expected to be in the range of $2.3-$2.5 billion compared with $2.1-$2.35 billion anticipated earlier. This suggests an increase from $1.768 billion reported in 2022.
Zacks Rank
Currently, URI carries a Zacks Rank #2 (Buy). You can see the complete list of today’s Zacks #1 Rank (Strong Buy) stocks here.
A Few Recent Construction Releases
Otis Worldwide Corporation’s OTIS second-quarter 2023 earnings and sales surpassed the Zacks Consensus Estimate. Its quarterly results reflected 11th consecutive quarters of organic sales growth and solid operating margin expansion contributing to mid-single digit adjusted earnings per share growth.
The company remains focused on strong portfolio growth and generating a solid New Equipment backlog. It also intends to expand operating margins, return cash to shareholders through a capital-allocation strategy and pursue additional progress toward ESG goals.
Armstrong World Industries, Inc. AWI reported mixed results for second-quarter 2023, wherein earnings surpassed the Zacks Consensus Estimate, but net sales missed the same. Both metrics increased on a year-over-year basis.
AWI’s results were backed by robust growth in operating income and adjusted EBITDA, as well as expanded margins, fueled by positive performances from both the Mineral Fiber and Architectural Specialties segments. The company remain focused on advancing digital and healthy spaces initiatives and pursuing attractive, bolt-on acquisitions.
D.R. Horton, Inc. DHI reported third-quarter fiscal 2023 (ended Jun 30, 2023) results, wherein earnings and revenues surpassed their respective Zacks Consensus Estimate.
On a year-over-year basis, although DHI’s earnings declined, revenues increased. The company highlighted that the supply of both new and existing homes at affordable price points remains limited and that the demographics supporting housing demand remain favorable. This tailwind has helped this Arlington, TX-based homebuilder to witness net sales order growth of 37% year over year in the fiscal third quarter.
Want the latest recommendations from Zacks Investment Research? Today, you can download 7 Best Stocks for the Next 30 Days. Click to get this free report
D.R. Horton, Inc. (DHI) : Free Stock Analysis Report
Armstrong World Industries, Inc. (AWI) : Free Stock Analysis Report
United Rentals, Inc. (URI) : Free Stock Analysis Report
Otis Worldwide Corporation (OTIS) : Free Stock Analysis Report
