Universal Display (NASDAQ:OLED) Reports Weak Q3, Stock Drops

OLED provider Universal Display (NASDAQ:OLED) missed analysts' expectations in Q3 FY2023, with revenue down 12.1% year on year to $141.1 million. Next quarter's outlook also missed expectations with revenue guided to $577.5 at the midpoint. Turning to EPS, Universal Display made a GAAP profit of $1.08 per share, down from its profit of $1.12 per share in the same quarter last year.
Is now the time to buy Universal Display? Find out by accessing our full research report, it's free.
Universal Display (OLED) Q3 FY2023 Highlights:
Revenue: $141.1 million vs analyst estimates of $149 million (5.31% miss)
EPS: $1.08 vs analyst estimates of $1 (8.4% beat)
The company lowered its revenue guidance for the full year of $577.5 million at the midpoint
Free Cash Flow of $35.4 million is up from -$8.4 million in the previous quarter
Inventory Days Outstanding: 482, up from 463 in the previous quarter
Gross Margin (GAAP): 75.7%, in line with the same quarter last year
“As we approach the end of 2023, our performance for the year remains on course. Looking ahead, we believe that multiple market verticals are driving the OLED industry’s long-term growth path,” said Brian Millard, Vice President and Chief Financial Officer of Universal Display Corporation.
Serving major consumer electronics manufacturers, Universal Display (NASDAQ:OLED) is a provider of organic light emitting diode (OLED) technologies used in display and lighting applications.
Analog Semiconductors
Demand for analog chips is generally linked to the overall level of economic growth, as analog chips serve as the building blocks of most electronic goods and equipment. Unlike digital chip designers, analog chip makers tend to produce the majority of their own chips, as analog chip production does not require expensive leading edge nodes. Less dependent on major secular growth drivers, analog product cycles are much longer, often 5-7 years.
Sales Growth
Universal Display's revenue growth over the last three years has been solid, averaging 19.6% annually. But as you can see below, its revenue declined from $160.6 million in the same quarter last year to $141.1 million. Semiconductors are a cyclical industry, and long-term investors should be prepared for periods of high growth followed by periods of revenue contractions (which can sometimes offer opportune times to buy).
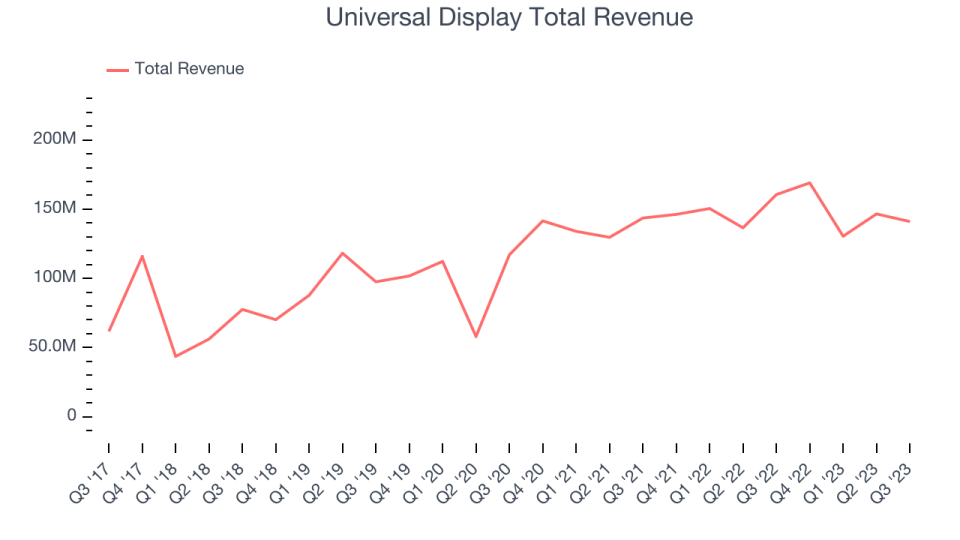
Universal Display had a difficult quarter as revenue dropped 12.1% year on year, missing analysts' estimates by 5.31%.
The pandemic fundamentally changed several consumer habits. There is a founder-led company that is massively benefiting from this shift. The business has grown astonishingly fast, with 40%+ free cash flow margins. Its fundamentals are undoubtedly best-in-class. Still, the total addressable market is so big that the company has room to grow many times in size. You can find it on our platform for free.
Product Demand & Outstanding Inventory
Days Inventory Outstanding (DIO) is an important metric for chipmakers, as it reflects a business' capital intensity and the cyclical nature of semiconductor supply and demand. In a tight supply environment, inventories tend to be stable, allowing chipmakers to exert pricing power. Steadily increasing DIO can be a warning sign that demand is weak, and if inventories continue to rise, the company may have to downsize production.
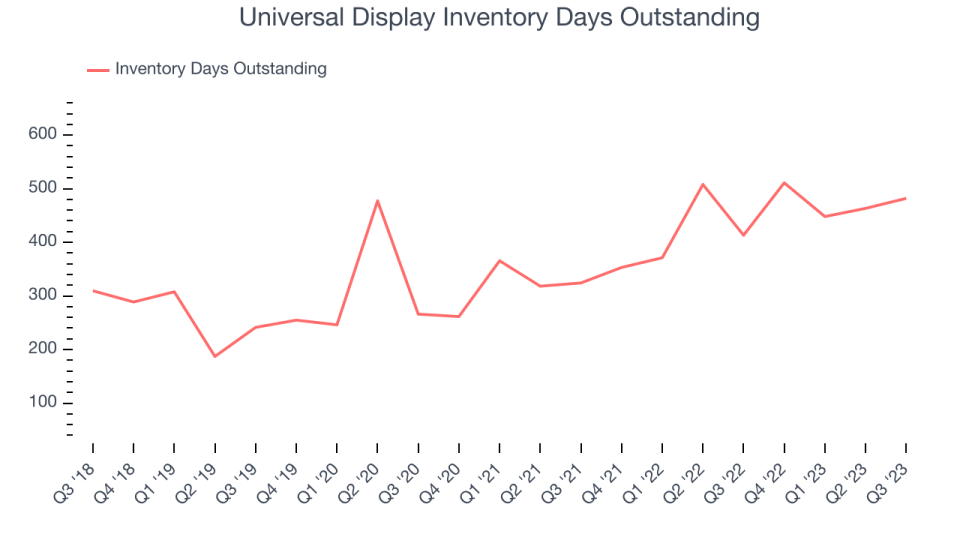
This quarter, Universal Display's DIO came in at 482, which is 128 days above its five-year average, suggesting that the company's inventory has grown to higher levels than we've seen in the past.
Key Takeaways from Universal Display's Q3 Results
Sporting a market capitalization of $6.49 billion, Universal Display is among smaller companies, but its more than $491.7 million in cash on hand and positive free cash flow over the last 12 months puts it in an attractive position to invest in growth.
It was great to see Universal Display improve its operating margin this quarter. That really stood out as a positive in these results. On the other hand, its revenue missed analysts' expectations, driven by poor performance in its royalty and licensing division. Its full-year revenue guidance was also lowered, something we've observed across the broader semiconductor industry. Overall, this was a mediocre quarter for Universal Display. The company is down 6.21% on the results and currently trades at $133.25 per share.
Universal Display may have had a tough quarter, but does that actually create an opportunity to invest right now? When making that decision, it's important to consider its valuation, business qualities, as well as what has happened in the latest quarter. We cover that in our actionable full research report which you can read here, it's free.
One way to find opportunities in the market is to watch for generational shifts in the economy. Almost every company is slowly finding itself becoming a technology company and facing cybersecurity risks and as a result, the demand for cloud-native cybersecurity is skyrocketing. This company is leading a massive technological shift in the industry and with revenue growth of 50% year on year and best-in-class SaaS metrics it should definitely be on your radar.
Join Paid Stock Investor Research
Help us make StockStory more helpful to investors like yourself. Join our paid user research session and receive a $50 Amazon gift card for your opinions. Sign up here.
The author has no position in any of the stocks mentioned in this report.
