Universal Display (OLED): A Comprehensive Analysis of Its Market Value
Universal Display Corp (NASDAQ:OLED) has seen a daily loss of -2.94% and a 3-month gain of 9.57%. With an Earnings Per Share (EPS) of 4.35, the question arises: is the stock fairly valued? This article seeks to provide an in-depth analysis of the company's valuation, financial strength, profitability, and growth. Keep reading to discover more.
Company Overview
Universal Display Corp (NASDAQ:OLED) is a renowned entity that researches, develops, and manufactures organic light-emitting diode (NASDAQ:OLED) technologies. These technologies are utilized in displays for mobile phones, tablets, televisions, wearables, personal computers, automotive interiors, and the solid-state lighting market. Primarily, the company generates its revenue in South Korea, with the rest coming from Japan, China, the United States, and other countries across the world.
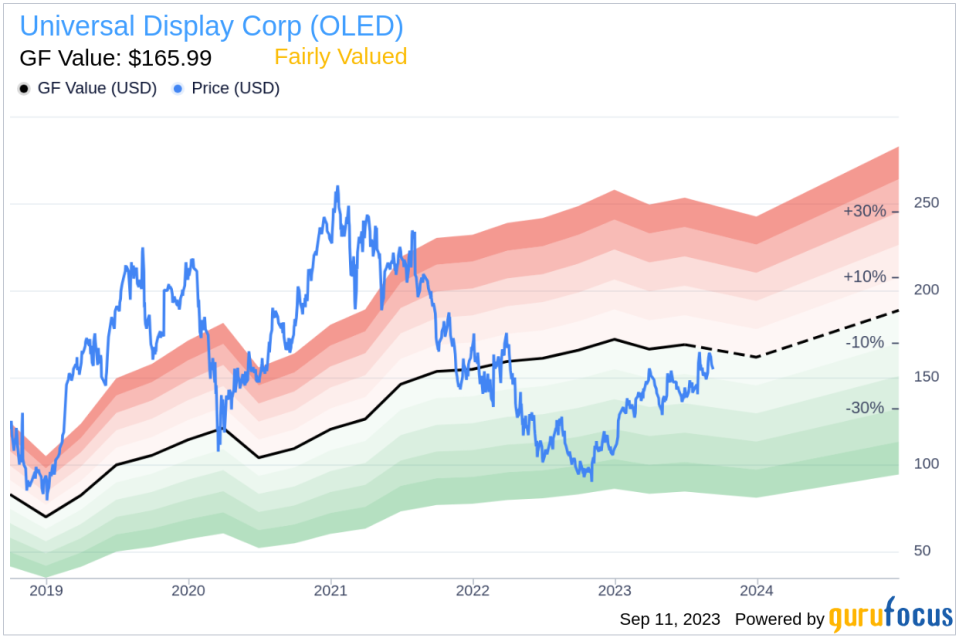
Currently, the company's stock price stands at $154.01, which is fairly close to its GF Value of $165.99. This suggests that Universal Display (NASDAQ:OLED) is fairly valued. Here is a detailed income breakdown of Universal Display:

Understanding GF Value
The GF Value is a unique measure of a stock's intrinsic value, calculated based on historical multiples, a GuruFocus adjustment factor, and future business performance estimates. The GF Value Line provides an overview of the fair value that the stock should be traded at. If the stock price is significantly above the GF Value Line, it is overvalued and its future return is likely to be poor. Conversely, if it is significantly below the GF Value Line, its future return will likely be higher.
Based on GuruFocus' valuation method, Universal Display (NASDAQ:OLED) appears to be fairly valued. This indicates that the long-term return of its stock is likely to be close to the rate of its business growth.
Link: These companies may deliver higher future returns at reduced risk.
Financial Strength
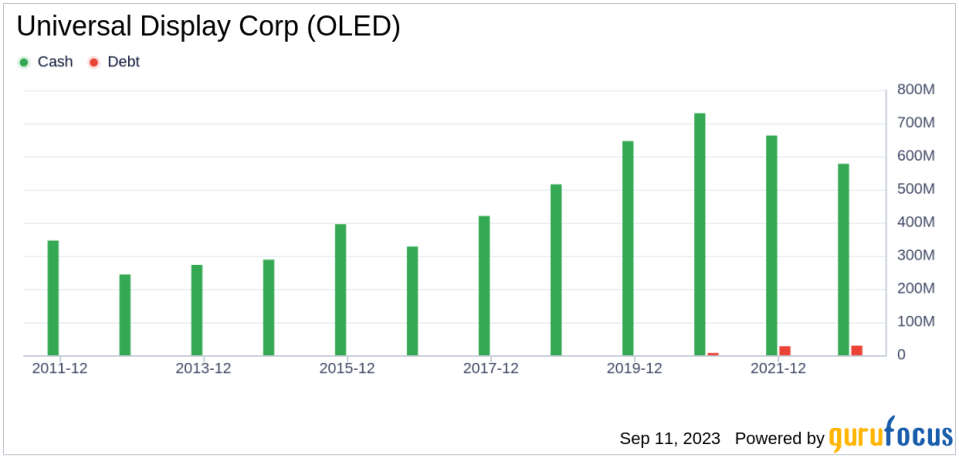
Investing in companies with low financial strength could result in permanent capital loss. Therefore, it's essential to review a company's financial strength before investing. Universal Display has a cash-to-debt ratio of 20.56, ranking better than 82.77% of 2350 companies in the Hardware industry. This suggests a strong balance sheet.
Here's a look at the debt and cash of Universal Display over the past years:
Profitability and Growth
Companies that have consistently been profitable over the long term offer less risk for investors. Universal Display has been profitable 10 over the past 10 years. Its operating margin is 42.13%, ranking better than 99.34% of 2420 companies in the Hardware industry. This indicates strong profitability.
One crucial factor in a company's valuation is its growth. Companies that grow faster create more value for shareholders, especially if that growth is profitable. Universal Display's average annual revenue growth is 14.6%, ranking better than 77.73% of 2313 companies in the Hardware industry. The 3-year average EBITDA growth is 16.7%, ranking better than 60.94% of 1938 companies in the Hardware industry.
ROIC vs WACC
Another way to evaluate a company's profitability is to compare its return on invested capital (ROIC) to its weighted cost of capital (WACC). ROIC measures how well a company generates cash flow relative to the capital it has invested in its business. WACC is the rate that a company is expected to pay on average to all its security holders to finance its assets. If the ROIC is higher than the WACC, it indicates that the company is creating value for shareholders. Over the past 12 months, Universal Display's ROIC was 22.87, while its WACC came in at 12.73.
Here's a historical ROIC vs WACC comparison of Universal Display:

Conclusion
In summary, the stock of Universal Display (NASDAQ:OLED) appears to be fairly valued. The company's financial condition is strong, and its profitability is robust. Its growth ranks better than 60.94% of 1938 companies in the Hardware industry. To learn more about Universal Display stock, check out its 30-Year Financials here.
To find out the high-quality companies that may deliver above-average returns, please check out the GuruFocus High Quality Low Capex Screener.
This article first appeared on GuruFocus.
