Unlocking Zebra Technologies (ZBRA)'s True Worth: An In-depth Analysis of Its Market Value
Zebra Technologies Corp (NASDAQ:ZBRA), a prominent provider of automatic identification and data capture technology, has seen a daily gain of 2.16% and a 3-month loss of -20.12% in its stock price. With an Earnings Per Share (EPS) (EPS) of 12.51, the question arises: Is Zebra Technologies significantly undervalued? This article presents a comprehensive valuation analysis of the company, providing valuable insights for potential investors.
Company Overview
Zebra Technologies primarily serves the retail, transportation logistics, manufacturing, and healthcare markets. It designs custom solutions to improve efficiency at its customers, offering barcode printers and scanners, mobile computers, and workflow optimization software. As of September 28, 2023, Zebra Technologies has a market cap of $11.80 billion and trades at $230.8 per share. However, the GF Value, an estimation of the stock's fair value, is pegged at $356.07, indicating that the stock might be significantly undervalued.
Understanding GF Value
The GF Value is a proprietary measure of a stock's intrinsic value, computed by considering historical trading multiples, a GuruFocus adjustment factor based on past performance and growth, and future business performance estimates. The GF Value Line provides an overview of the stock's ideal fair trading value. If the stock price is significantly above the GF Value Line, it may be overvalued and its future return is likely to be poor. Conversely, if it is significantly below the GF Value Line, its future return will likely be higher.
Based on this valuation method, Zebra Technologies appears to be significantly undervalued. As Zebra Technologies is significantly undervalued, the long-term return of its stock is likely to be much higher than its business growth.
Assessing Financial Strength
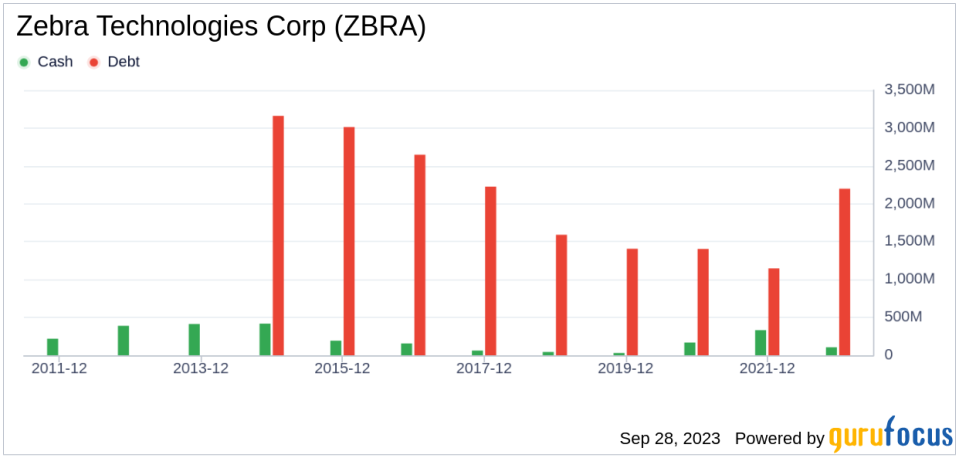
Before investing in a company, it's crucial to check its financial strength. Investing in companies with poor financial strength carries a higher risk of permanent loss. A look at the cash-to-debt ratio and interest coverage can provide a solid understanding of a company's financial strength. Zebra Technologies has a cash-to-debt ratio of 0.03, which is worse than 97.89% of 2372 companies in the Hardware industry. However, the overall financial strength of Zebra Technologies is rated 6 out of 10, indicating fair financial health.
Profitability and Growth
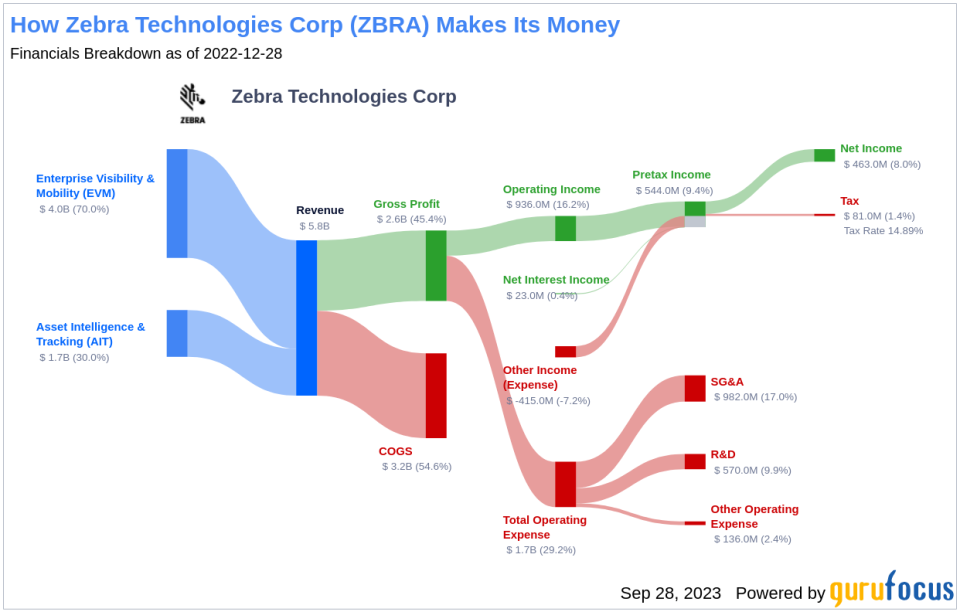
Investing in profitable companies carries less risk, especially those demonstrating consistent profitability over the long term. Zebra Technologies has been profitable 8 years over the past 10 years. With revenues of $5.50 billion and an EPS of $12.51 in the past 12 months, the company's operating margin of 16.76% is better than 89.5% of companies in the Hardware industry. This indicates strong profitability .
One key factor in company valuation is growth . Companies that grow faster create more value for shareholders. Zebra Technologies has an average annual revenue growth of 10.2%, ranking better than 66.68% of companies in the Hardware industry. Its 3-year average EBITDA growth is 11.2%, which ranks better than 50.74% of companies in the same industry.
ROIC vs WACC
Comparing a company's return on invested capital (ROIC) to the weighted average cost of capital (WACC) can help determine its profitability. ROIC measures how well a company generates cash flow relative to the capital it has invested in its business. WACC is the rate that a company is expected to pay on average to all its security holders to finance its assets. When the ROIC is higher than the WACC, it implies the company is creating value for shareholders. For the past 12 months, Zebra Technologies's ROIC is 11.67, and its cost of capital is 13.19.
Conclusion
In conclusion, Zebra Technologies appears to be significantly undervalued. The company's financial condition is fair, its profitability is strong, and its growth ranks better than 50.74% of companies in the Hardware industry. To learn more about Zebra Technologies stock, you can check out its 30-Year Financials here.
To find out high quality companies that may deliver above average returns, please check out GuruFocus High Quality Low Capex Screener.
This article first appeared on GuruFocus.


