Unmasking the Potential Value Trap: An In-Depth Analysis of Celanese Corp (CE)
Value-focused investors are constantly seeking stocks that are priced below their intrinsic value. One such stock that has recently caught the attention of investors is Celanese Corp (NYSE:CE). Currently priced at $119.01, the stock recorded a loss of 4.26% in a single day and a 3-month increase of 14.06%. Celanese's fair valuation, as indicated by its GF Value, stands at $189.12.
Understanding the GF Value
The GF Value represents the current intrinsic value of a stock derived from our exclusive method. The GF Value Line on our summary page gives an overview of the fair value that the stock should be traded at. It is calculated based on three factors:
Historical multiples (PE Ratio, PS Ratio, PB Ratio and Price-to-Free-Cash-Flow) that the stock has traded at.
GuruFocus adjustment factor based on the company's past returns and growth.
Future estimates of the business performance.
We believe the GF Value Line is the fair value that the stock should be traded at. The stock price will most likely fluctuate around the GF Value Line. If the stock price is significantly above the GF Value Line, it is overvalued and its future return is likely to be poor. On the other hand, if it is significantly below the GF Value Line, its future return will likely be higher.
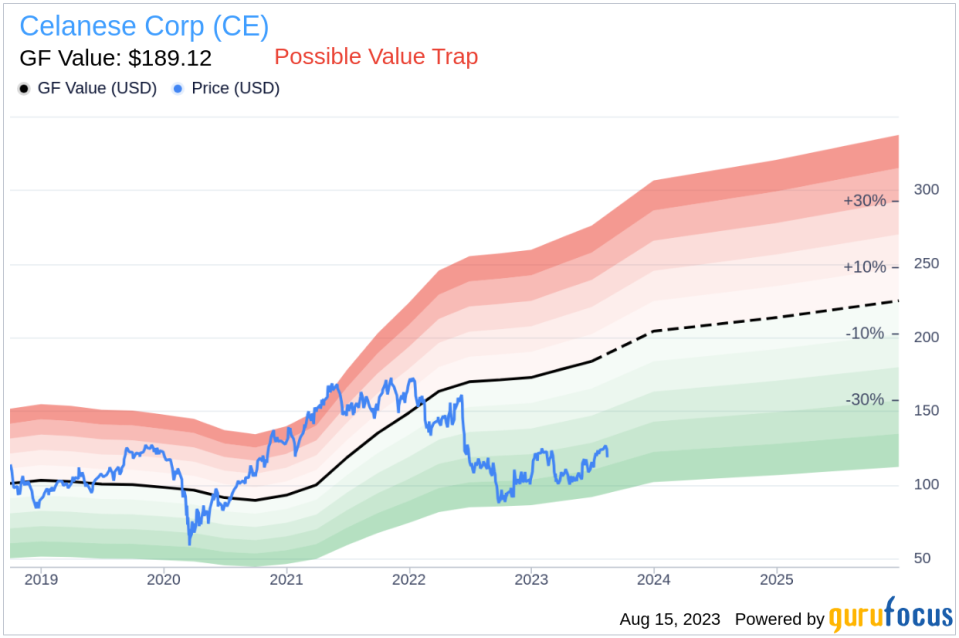
Investor Alert: Potential Value Trap
Despite its seemingly attractive valuation, certain risk factors associated with Celanese should not be ignored. These risks are primarily reflected through its low Altman Z-score of 1.71. These indicators suggest that Celanese, despite its apparent undervaluation, might be a potential value trap. This complexity underlines the importance of thorough due diligence in investment decision-making.
Deciphering the Altman Z-Score
The Altman Z-score is a financial model that predicts the probability of a company entering bankruptcy within a two-year timeframe. Invented by New York University Professor Edward I. Altman in 1968, the Z-Score combines five different financial ratios, each weighted to create a final score. A score below 1.8 suggests a high likelihood of financial distress, while a score above 3 indicates a low risk.
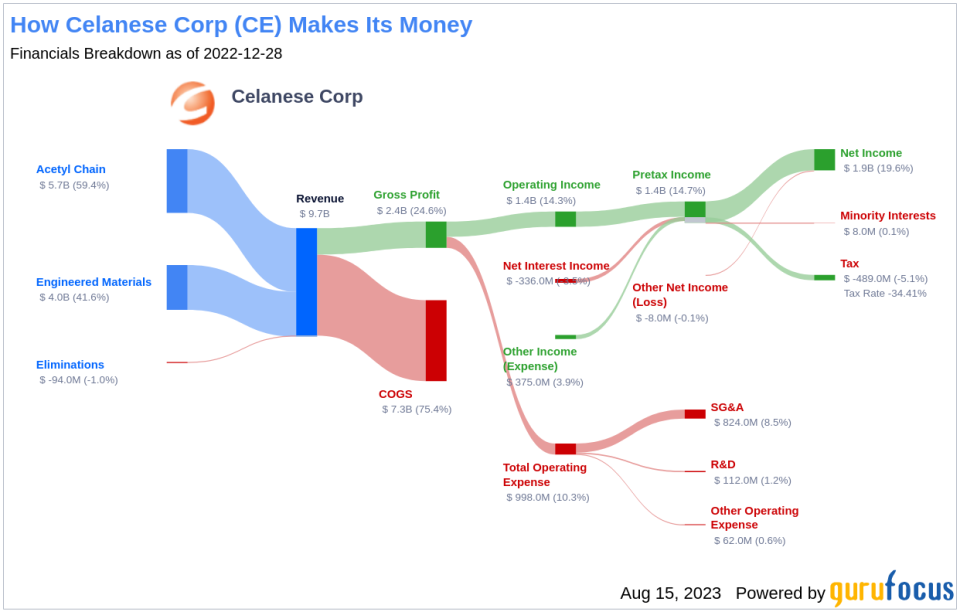
An Overview of Celanese Corp
Celanese is one of the world's largest producers of acetic acid and its downstream derivative chemicals, which are used in various end markets, including coatings and adhesives. The company also produces specialty polymers used in the automotive, electronics, medical, and consumer end markets as well as cellulose derivatives used in cigarette filters.
Breaking Down Celanese's Low Altman Z-Score
The EBIT to Total Assets ratio serves as a crucial barometer of a company's operational effectiveness, correlating earnings before interest and taxes (EBIT) to total assets. An analysis of Celanese's EBIT to Total Assets ratio from historical data (2021: 0.27; 2022: 0.20; 2023: 0.05) indicates a descending trend. This reduction suggests that Celanese might not be utilizing its assets to their full potential to generate operational profits, which could be negatively affecting the company's overall Z-score.
Conclusion: A Potential Value Trap?
Despite the attractive valuation, Celanese's low Altman Z-score and declining EBIT to Total Assets ratio suggest that the company might be a potential value trap. This underlines the importance of thorough due diligence and comprehensive analysis before making investment decisions. GuruFocus Premium members can find stocks with high Altman Z-Score using the Walter Schloss Screen .
This article first appeared on GuruFocus.
