Unmasking the Value Trap: A Comprehensive Analysis of RiceBran Technologies (RIBT)
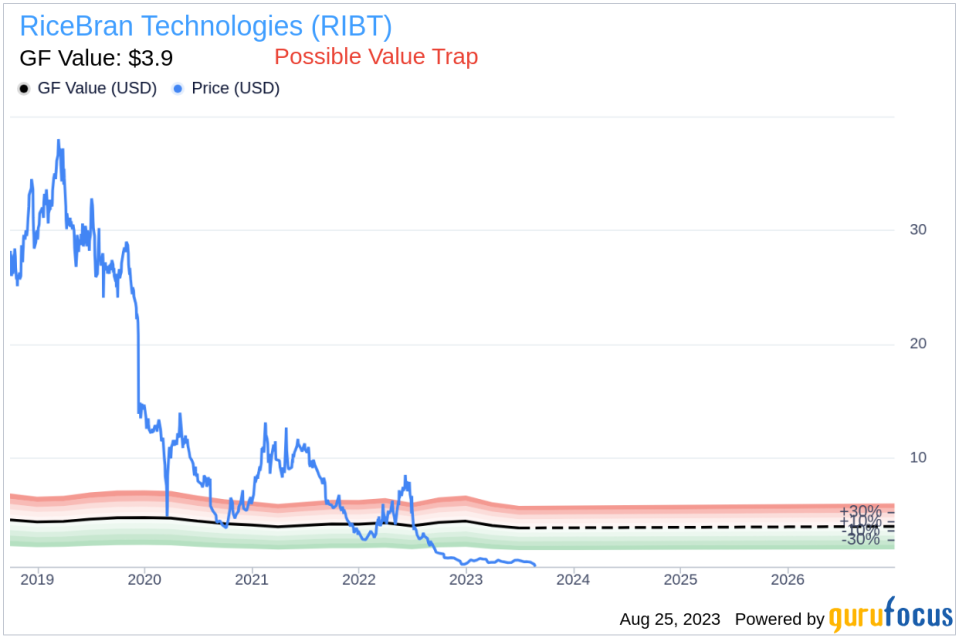
Value-focused investors are always on the hunt for stocks that are priced below their intrinsic value. One such stock that merits attention is RiceBran Technologies (NASDAQ:RIBT). The stock, which is currently priced at 0.5, recorded a loss of 15.27% in a day and a 3-month decrease of 40.82%. The stock's fair valuation is $3.9, as indicated by its GF Value.
Understanding the GF Value
The GF Value represents the current intrinsic value of a stock derived from our exclusive method. The GF Value Line on our summary page gives an overview of the fair value that the stock should be traded at. It is calculated based on historical multiples (PE Ratio, PS Ratio, PB Ratio and Price-to-Free-Cash-Flow) that the stock has traded at, GuruFocus adjustment factor based on the company's past returns and growth, and future estimates of the business performance.
However, investors need to consider a more in-depth analysis before making an investment decision. Despite its seemingly attractive valuation, certain risk factors associated with RiceBran Technologies should not be ignored. These risks are primarily reflected through its low Altman Z-score of -39.48, and the company's revenues and earnings have been on a downward trend over the past five years, which raises a crucial question: Is RiceBran Technologies a hidden gem or a value trap?
Decoding the Altman Z-Score
Before delving into the details, let's understand what the Altman Z-score entails. Invented by New York University Professor Edward I. Altman in 1968, the Z-Score is a financial model that predicts the probability of a company entering bankruptcy within a two-year time frame. The Altman Z-Score combines five different financial ratios, each weighted to create a final score. A score below 1.8 suggests a high likelihood of financial distress, while a score above 3 indicates a low risk.
Unveiling RiceBran Technologies
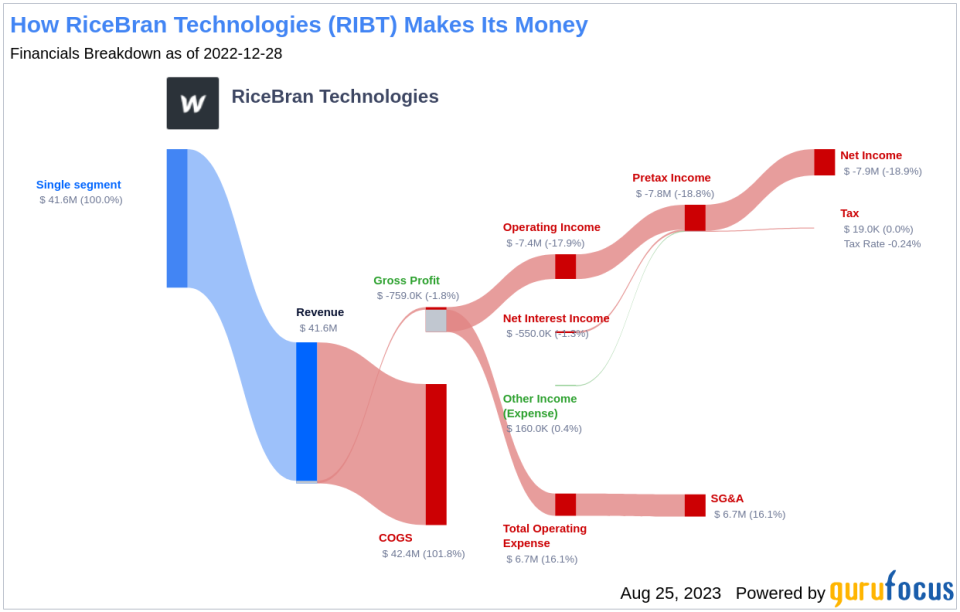
RiceBran Technologies is a specialty ingredient company focused on the development, production, and marketing of products derived from traditional and ancient small grains. The company has proprietary and patented intellectual property that allows it to convert rice bran, into a number of highly nutritious food, animal nutrition, and specialty ingredient products. Its existing and target customers are food and animal nutrition manufacturers, wholesalers, and retailers, both domestically and internationally.
RiceBran Technologies's Low Altman Z-Score: A Breakdown of Key Drivers
A dissection of RiceBran Technologies's Altman Z-score reveals RiceBran Technologies's financial health may be weak, suggesting possible financial distress:
The first factor we need to consider is a measure of short-term liquidity. This is calculated as the working capital divided by total assets. When we evaluate the data provided: 2021: -0.02; 2022: -0.04; 2023: -0.10, it's clear that RiceBran Technologies has experienced a declining trend in its Working Capital to Total Assets ratio over the past few years. This decline suggests potential liquidity issues that the company may be facing. The ratio is strikingly low, which unfavorably influences the overall Z-Score.
The Retained Earnings to Total Assets ratio provides insights into a company's capability to reinvest its profits or manage debt. Evaluating RiceBran Technologies's historical data, 2021: -9.19; 2022: -10.43; 2023: -28.87, we observe a declining trend in this ratio. This downward movement indicates RiceBran Technologies's diminishing ability to reinvest in its business or effectively manage its debt. Consequently, it exerts a negative impact on its Z-Score.
The EBIT to Total Assets ratio serves as a crucial barometer of a company's operational effectiveness, correlating earnings before interest and taxes (EBIT) to total assets. An analysis of RiceBran Technologies's EBIT to Total Assets ratio from historical data (2021: -0.17; 2022: -0.36; 2023: -0.60) indicates a descending trend. This reduction suggests that RiceBran Technologies might not be utilizing its assets to their full potential to generate operational profits, which could be negatively affecting the company's overall Z-score.
The Bearish Signs: Declining Revenues and Earnings
One of the telltale indicators of a company's potential trouble is a sustained decline in revenues. In the case of RiceBran Technologies, both the revenue per share (evident from the last five years' TTM data: 2019: 7.18; 2020: 6.90; 2021: 6.32; 2022: 6.26; 2023: 5.98; ) and the 5-year revenue growth rate (-6.1%) have been on a consistent downward trajectory. This pattern may point to underlying challenges such as diminishing demand for RiceBran Technologies's products, or escalating competition in its market sector. Either scenario can pose serious risks to the company's future performance, warranting a thorough analysis by investors.
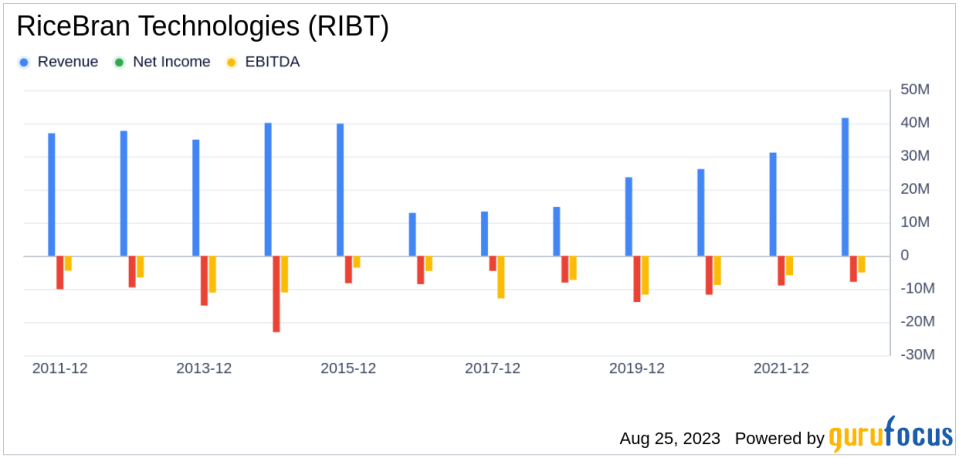
The Red Flag: Sluggish Earnings Growth
Despite its low price-to-fair-value ratio, RiceBran Technologies's falling revenues and earnings cast a long shadow over its investment attractiveness. A low price relative to intrinsic value can indeed suggest an investment opportunity, but only if the company's fundamentals are sound or improving. In RiceBran Technologies's case, the declining revenues, EBITDA, and earnings growth suggest that the company's issues may be more than just cyclical fluctuations.
Without a clear turnaround strategy, there's a risk that the company's performance could continue to deteriorate, leading to further price declines. In such a scenario, the low price-to-GF-Value ratio may be more indicative of a value trap than a value opportunity.
Conclusion
Investing in RiceBran Technologies could be a risky proposition. The company's declining revenues, earnings, and a low Altman Z-Score all point towards a potential value trap. Therefore, it is crucial for investors to conduct thorough due diligence before making an investment decision. GuruFocus Premium members can find stocks with high Altman Z-Score using the following Screener: Walter Schloss Screen . Investors can find stocks with good revenue and earnings growth using GuruFocus' Peter Lynch Growth with Low Valuation Screener.
This article first appeared on GuruFocus.
