Unmasking the Value Trap: A Deep Dive into Avinger Inc (AVGR)
Value-focused investors are always on the hunt for stocks that are priced below their intrinsic value. One such stock that merits attention is Avinger Inc (NASDAQ:AVGR). The stock, which is currently priced at 0.5, recorded a loss of 13.59% in a day and a 3-month decrease of 14.63%. The stock's fair valuation is $0.9, as indicated by its GF Value.
Understanding GF Value
The GF Value represents the current intrinsic value of a stock derived from our exclusive method. The GF Value Line on our summary page gives an overview of the fair value that the stock should be traded at. It is calculated based on three factors:
1. Historical multiples (PE Ratio, PS Ratio, PB Ratio and Price-to-Free-Cash-Flow) that the stock has traded at.
2. GuruFocus adjustment factor based on the company's past returns and growth.
3. Future estimates of the business performance.
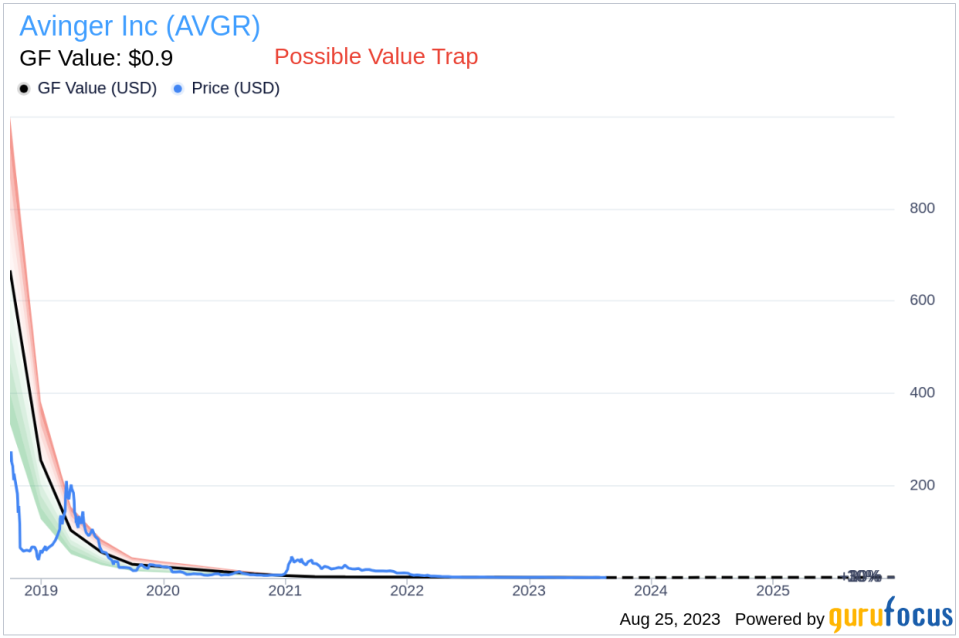
However, investors need to consider a more in-depth analysis before making an investment decision. Despite its seemingly attractive valuation, certain risk factors associated with Avinger should not be ignored. These risks are primarily reflected through its low Altman Z-score of -36.91, and the company's revenues and earnings have been on a downward trend over the past five years, which raises a crucial question: Is Avinger a hidden gem or a value trap? These indicators suggest that Avinger, despite its apparent undervaluation, might be a potential value trap. This complexity underlines the importance of thorough due diligence in investment decision-making.
Understanding Altman Z-Score
Before delving into the details, let's understand what the Altman Z-score entails. Invented by New York University Professor Edward I. Altman in 1968, the Z-Score is a financial model that predicts the probability of a company entering bankruptcy within a two-year time frame. The Altman Z-Score combines five different financial ratios, each weighted to create a final score. A score below 1.8 suggests a high likelihood of financial distress, while a score above 3 indicates a low risk.
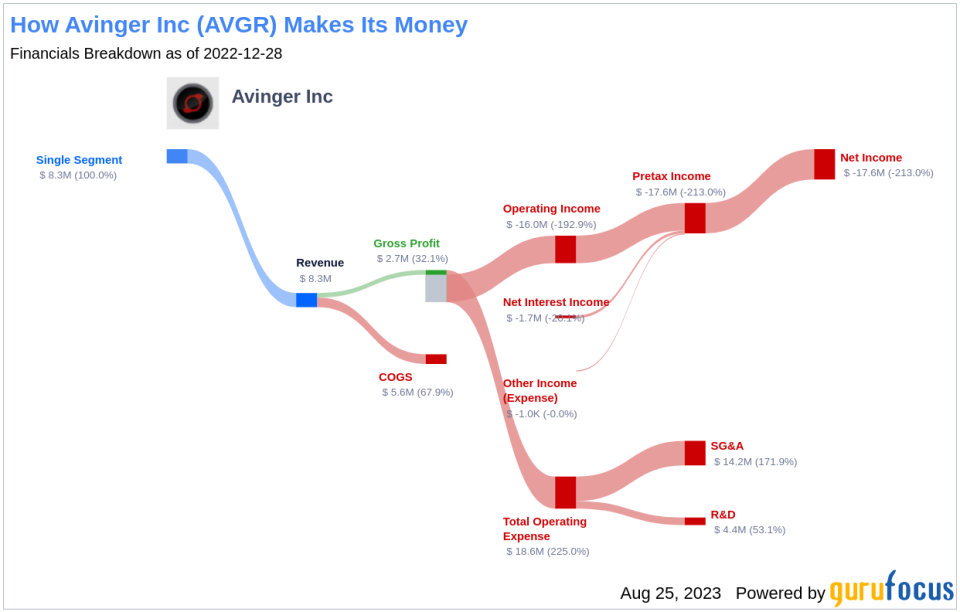
Company Introduction
Avinger Inc is a United States-based medical device company. It is engaged in designing, manufacturing and selling image-guided, catheter-based systems that are used by physicians to treat patients with peripheral artery disease (PAD). The products offered by the firm include Lightbox imaging console, the Ocelot family of catheters, which are designed to allow physicians to penetrate a total blockage in an artery, known as a chronic total occlusion (CTO) and Pantheris, image-guided atherectomy device which is designed to allow physicians to precisely remove arterial plaque in PAD patients.
Avinger's Low Altman Z-Score: A Breakdown of Key Drivers
A dissection of Avinger's Altman Z-score reveals Avinger's financial health may be weak, suggesting possible financial distress:
The first factor we need to consider is a measure of short-term liquidity. This is calculated as the working capital divided by total assets. When we evaluate the data provided: 2021: 0.05; 2022: -0.01; 2023: -0.08, it's clear that Avinger has experienced a declining trend in its Working Capital to Total Assets ratio over the past few years. This decline suggests potential liquidity issues that the company may be facing. The ratio is strikingly low, which unfavorably influences the overall Z-Score.
The Retained Earnings to Total Assets ratio provides insights into a company's capability to reinvest its profits or manage debt. Evaluating Avinger's historical data, 2021: -9.82; 2022: -14.51; 2023: -24.27, we observe a declining trend in this ratio. This downward movement indicates Avinger's diminishing ability to reinvest in its business or effectively manage its debt. Consequently, it exerts a negative impact on its Z-Score.
The EBIT to Total Assets ratio serves as a crucial barometer of a company's operational effectiveness, correlating earnings before interest and taxes (EBIT) to total assets. An analysis of Avinger's EBIT to Total Assets ratio from historical data (2021: -0.39; 2022: -0.73; 2023: -0.91) indicates a descending trend. This reduction suggests that Avinger might not be utilizing its assets to their full potential to generate operational profits, which could be negatively affecting the company's overall Z-score.
When it comes to operational efficiency, a vital indicator for Avinger is its asset turnover. The data: 2021: 0.29; 2022: 0.27; 2023: 0.35 from the past three years suggests a recent decline following an initial increase in this ratio. The asset turnover ratio reflects how effectively a company is using its assets to generate sales. Therefore, a drop in this ratio can signify reduced operational efficiency, potentially due to underutilization of assets or decreased market demand for the company's products or services. This shift in Avinger's asset turnover underlines the need for the company to reassess its operational strategies to optimize asset usage and boost sales.
The Bearish Signs: Declining Revenues and Earnings
One of the telltale indicators of a company's potential trouble is a sustained decline in revenues. In the case of Avinger, both the revenue per share (evident from the last five years' TTM data: 2019: 63.61; 2020: 15.20; 2021: 2.45; 2022: 1.76; 2023: 1.05; ) and the 5-year revenue growth rate (-78.5%) have been on a consistent downward trajectory. This pattern may point to underlying challenges such as diminishing demand for Avinger's products, or escalating competition in its market sector. Either scenario can pose serious risks to the company's future performance, warranting a thorough analysis by investors.
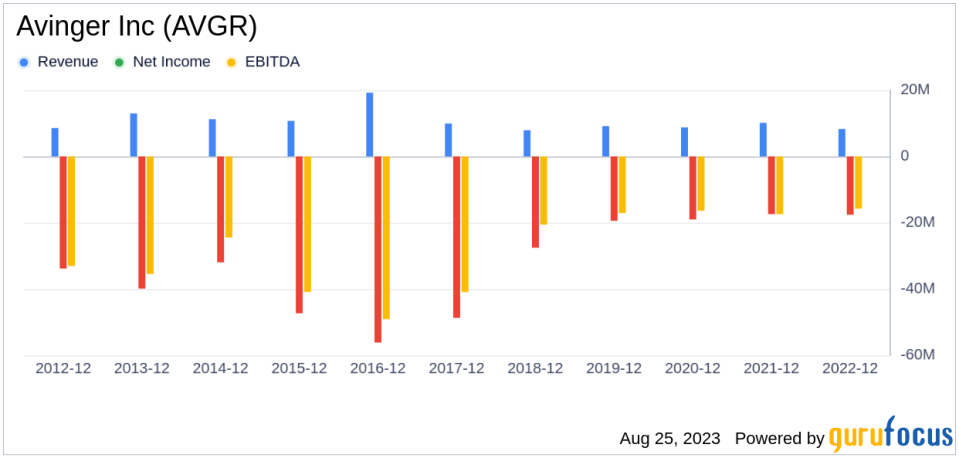
The Red Flag: Sluggish Earnings Growth
Despite its low price-to-fair-value ratio, Avinger's falling revenues and earnings cast a long shadow over its investment attractiveness. A low price relative to intrinsic value can indeed suggest an investment opportunity, but only if the company's fundamentals are sound or improving. In Steelcase's case, the declining revenues, EBITDA, and earnings growth suggest that the company's issues may be more than just cyclical fluctuations.
Without a clear turnaround strategy, there's a risk that the company's performance could continue to deteriorate, leading to further price declines. In such a scenario, the low price-to-GF-Value ratio may be more indicative of a value trap than a value opportunity.
Conclusion
Despite its seemingly attractive valuation, Avinger's declining revenues, earnings, and low Altman Z-Score suggest that it may not be the hidden gem investors are hoping for. Instead, it might be a potential value trap. Investors should approach Avinger with caution, conducting thorough due diligence before making an investment decision.
GuruFocus Premium members can find stocks with high Altman Z-Score using the following Screener: Walter Schloss Screen .Investors can find stocks with good revenue and earnings growth using GuruFocus' Peter Lynch Growth with Low Valuation Screener.
This article first appeared on GuruFocus.
