Unmasking the Value Trap: An In-Depth Look at Yunji Inc (YJ)
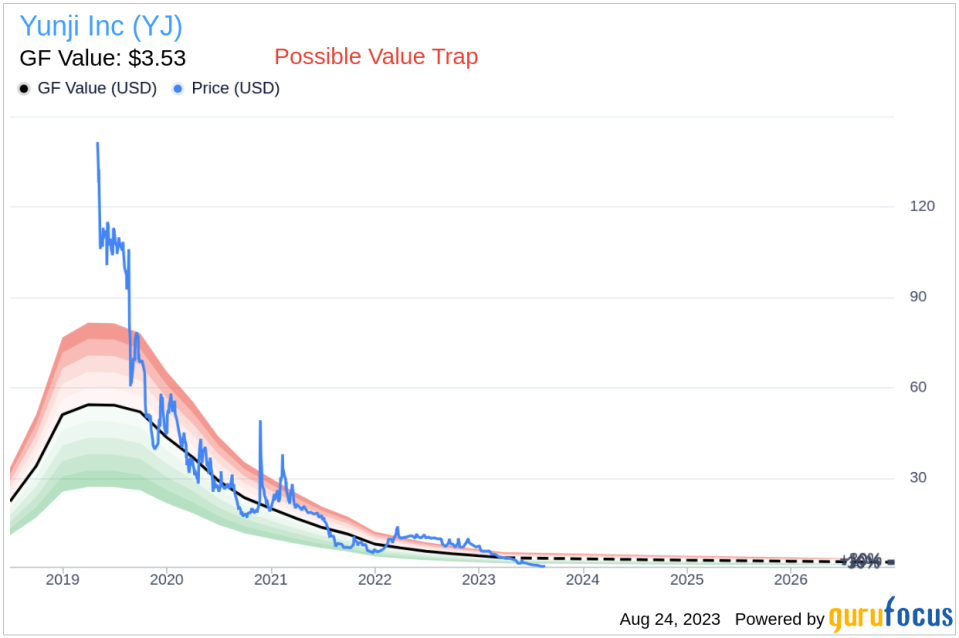
Value-focused investors are always on the hunt for stocks that are priced below their intrinsic value. One such stock that merits attention is Yunji Inc (NASDAQ:YJ). The stock, which is currently priced at 0.82, recorded a loss of 14.58% in a day and a 3-month decrease of 49.5%. The stock's fair valuation is $3.53, as indicated by its GF Value.
Understanding GF Value
The GF Value represents the current intrinsic value of a stock derived from our exclusive method. The GF Value Line on our summary page gives an overview of the fair value that the stock should be traded at. It is calculated based on three factors:
1. Historical multiples (PE Ratio, PS Ratio, PB Ratio and Price-to-Free-Cash-Flow) that the stock has traded at.
2. GuruFocus adjustment factor based on the company's past returns and growth.
3. Future estimates of the business performance.
However, investors need to consider a more in-depth analysis before making an investment decision. Despite its seemingly attractive valuation, certain risk factors associated with Yunji should not be ignored. These risks are primarily reflected through its low Altman Z-score of -3.76, and the company's revenues and earnings have been on a downward trend over the past five years, which raises a crucial question: Is Yunji a hidden gem or a value trap?
The Altman Z-Score: A Measure of Financial Health
Before delving into the details, let's understand what the Altman Z-score entails. Invented by New York University Professor Edward I. Altman in 1968, the Z-Score is a financial model that predicts the probability of a company entering bankruptcy within a two-year time frame. The Altman Z-Score combines five different financial ratios, each weighted to create a final score. A score below 1.8 suggests a high likelihood of financial distress, while a score above 3 indicates a low risk.
Yunji Inc (NASDAQ:YJ): A Snapshot
Yunji Inc is a social e-commerce platform in China that offers a membership-based model that leverages the power of social interaction. The company provides a host of selected commodities such as beauty and personal care, mobile phones and digital products, baby and maternal products, toys, fruits, and other fresh products. Geographically, the firm operates in China.
Yunji's Low Altman Z-Score: A Breakdown of Key Drivers
An examination of Yunji's Altman Z-score reveals Yunji's financial health may be weak, suggesting possible financial distress. The Retained Earnings to Total Assets ratio provides insights into a company's capability to reinvest its profits or manage debt. Evaluating Yunji's historical data, 2021: -2.49; 2022: -2.72; 2023: -3.44, we observe a declining trend in this ratio. This downward movement indicates Yunji's diminishing ability to reinvest in its business or effectively manage its debt. Consequently, it exerts a negative impact on its Z-Score.
Operational Efficiency: A Closer Look at Yunji's Asset Turnover
When it comes to operational efficiency, a vital indicator for Yunji is its asset turnover. The data: 2021: 1.62; 2022: 0.79; 2023: 0.49 from the past three years suggests a decreasing trend in this ratio. The asset turnover ratio reflects how effectively a company is using its assets to generate sales. Therefore, a drop in this ratio can signify reduced operational efficiency, potentially due to underutilization of assets or decreased market demand for the company's products or services. This shift in Yunji's asset turnover underlines the need for the company to reassess its operational strategies to optimize asset usage and boost sales.
The Bearish Signs: Declining Revenues and Earnings
One of the telltale indicators of a company's potential trouble is a sustained decline in revenues. In the case of Yunji, both the revenue per share (evident from the last five years' TTM data: 2019: 102.55; 2020: 69.99; 2021: 31.64; 2022: 13.24; 2023: 7; ) and the 5-year revenue growth rate (-35.2%) have been on a consistent downward trajectory. This pattern may point to underlying challenges such as diminishing demand for Yunji's products, or escalating competition in its market sector. Either scenario can pose serious risks to the company's future performance, warranting a thorough analysis by investors.
The Red Flag: Sluggish Earnings Growth
Despite its low price-to-fair-value ratio, Yunji's falling revenues and earnings cast a long shadow over its investment attractiveness. A low price relative to intrinsic value can indeed suggest an investment opportunity, but only if the company's fundamentals are sound or improving. In Yunji's case, the declining revenues, EBITDA, and earnings growth suggest that the company's issues may be more than just cyclical fluctuations. Without a clear turnaround strategy, there's a risk that the company's performance could continue to deteriorate, leading to further price declines. In such a scenario, the low price-to-GF-Value ratio may be more indicative of a value trap than a value opportunity.
Conclusion
In conclusion, while Yunji's stock may appear undervalued based on its GF Value, the company's declining revenues, earnings, and low Altman Z-Score suggest potential financial distress. These indicators suggest that Yunji, despite its apparent undervaluation, might be a potential value trap. This complexity underlines the importance of thorough due diligence in investment decision-making.
GuruFocus Premium members can find stocks with high Altman Z-Score using the following Screener: Walter Schloss Screen .Investors can find stocks with good revenue and earnings growth using GuruFocus' Peter Lynch Growth with Low Valuation Screener.
This article first appeared on GuruFocus.
