Unpacking the Investment Potential of CF Industries Holdings Inc (CF): A Deep Dive into ...
CF Industries Holdings Inc (NYSE:CF) has recently been in the spotlight, drawing interest from investors and financial analysts due to its robust financial stance. With shares currently priced at 83.74, CF Industries Holdings Inc has witnessed a surge of 0% over a period, marked against a three-month change of 23.98%. A thorough analysis, underlined by the GuruFocus Score Rating, suggests that CF Industries Holdings Inc is well-positioned for substantial growth in the near future.
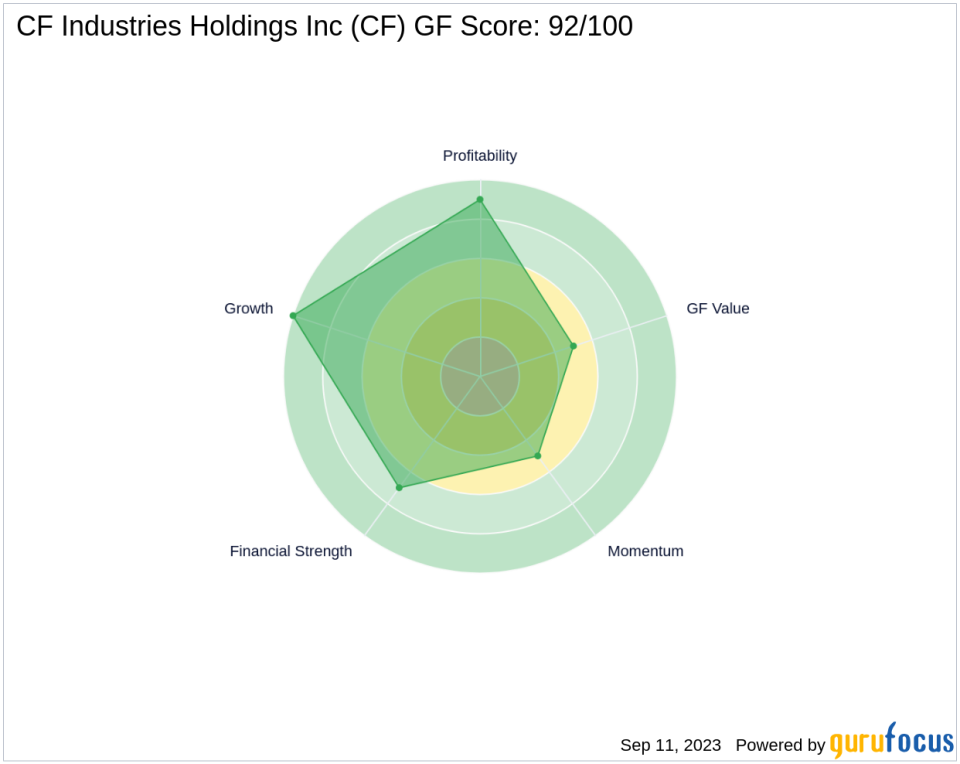
Decoding the GF Score
The GF Score is a stock performance ranking system developed by GuruFocus using five aspects of valuation, which has been found to be closely correlated to the long-term performances of stocks by backtesting from 2006 to 2021. The stocks with a higher GF Score generally generate higher returns than those with a lower GF Score. Therefore, when picking stocks, investors should invest in companies with high GF Scores. The GF Score ranges from 0 to 100, with 100 as the highest rank.
CF Industries Holdings Inc (NYSE:CF) has been assigned the following ranks:
1. Financial strength rank: 7/10
2. Profitability rank: 9/10
3. Growth rank: 10/10
4. GF Value rank: 5/10
5. Momentum rank: 5/10
Each one of these components is ranked and the ranks also have positive correlation with the long term performances of stocks. The GF score is calculated using the five key aspects of analysis. Through backtesting, we know that each of these key aspects has a different impact on the stock price performance. Thus, they are weighted differently when calculating the total score. With a high growth rank and a solid profitability rank, GuruFocus assigned CF Industries Holdings Inc the GF Score of 92 out of 100, which signals the highest outperformance potential.
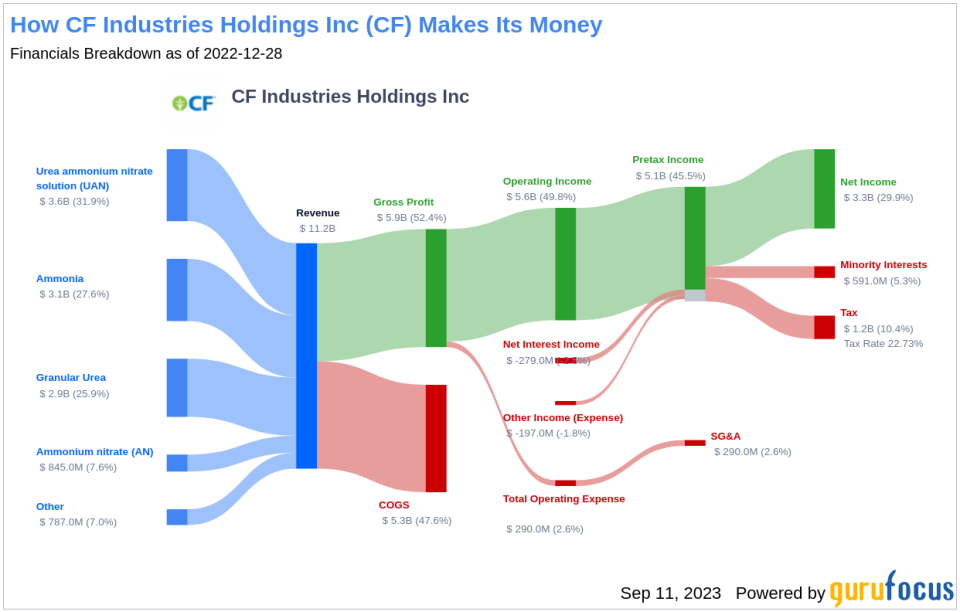
Understanding CF Industries Holdings Inc Business
CF Industries Holdings Inc, with a market cap of $16.16 billion and sales of $8.72 billion, is a leading producer and distributor of nitrogen fertilizers. The company operates seven nitrogen facilities in North America and holds joint venture interests in further production capacity in the United Kingdom and Trinidad and Tobago. CF makes nitrogen primarily using low-cost U.S. natural gas as its feedstock, making CF one of the lowest-cost nitrogen producers globally. The company is also investing in carbon-free blue and green ammonia, which can be used an alternative fuel to hydrogen or as a means to transport hydrogen. With an operating margin of 41.09%, the company has demonstrated strong profitability.
Financial Strength Breakdown
According to the Financial Strength rating, CF Industries Holdings Inc's robust balance sheet exhibits resilience against financial volatility, reflecting prudent management of capital structure. The Interest Coverage ratio for CF Industries Holdings Inc stands impressively at 39.35, underscoring its strong capability to cover its interest obligations. This robust financial position resonates with the wisdom of legendary investor Benjamin Graham, who favored companies with an interest coverage ratio of at least 5. With a favorable Debt-to-Revenue ratio of 0.37, CF Industries Holdings Inc's strategic handling of debt solidifies its financial health.
Profitability Rank Breakdown
The Profitability Rank shows CF Industries Holdings Inc's impressive standing among its peers in generating profit. CF Industries Holdings Inc Operating Margin has increased (205.51%) over the past five years, as shown by the following data: 2018: 16.30; 2019: 20.35; 2020: 14.50; 2021: 33.41; 2022: 49.80. Furthermore, CF Industries Holdings Inc's Gross Margin has seen a consistent rise over the past five years, as evidenced by the data: 2018: 20.70; 2019: 25.58; 2020: 19.42; 2021: 36.51; 2022: 52.40. This trend underscores the company's growing proficiency in transforming revenue into profit.
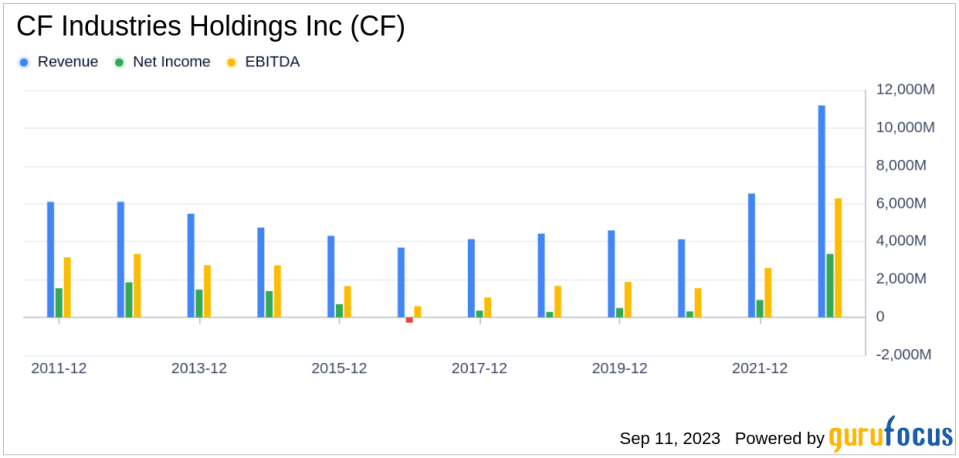
Growth Rank Breakdown
Ranked highly in Growth, CF Industries Holdings Inc demonstrates a strong commitment to expanding its business. The company's 3-Year Revenue Growth Rate is 38.3%, which outperforms better than 84.47% of 219 companies in the Agriculture industry. Moreover, CF Industries Holdings Inc has seen a robust increase in its earnings before interest, taxes, depreciation, and amortization (EBITDA) over the past few years. Specifically, the three-year growth rate stands at 53.9, and the rate over the past five years is 37. This trend accentuates the company's continued capability to drive growth.
Conclusion
Given CF Industries Holdings Inc's strong financial strength, profitability, and growth metrics, the GuruFocus Score Rating highlights the firm's unparalleled position for potential outperformance. This analysis underscores the company's robust financial health and growth potential, making it a compelling investment opportunity for value investors. GuruFocus Premium members can find more companies with strong GF Scores using the following screener link: GF Score Screen
This article first appeared on GuruFocus.
