Unpacking the Investment Potential of Tyler Technologies Inc (TYL): A Deep Dive into Financial ...
Tyler Technologies Inc (NYSE:TYL) has recently been in the spotlight, drawing interest from investors and financial analysts due to its robust financial stance. With shares currently priced at $383.67, Tyler Technologies Inc has witnessed a daily gain of 2.21%, marked against a three-month change of -3.27%. A thorough analysis, underlined by the GuruFocus Score Rating, suggests that Tyler Technologies Inc is well-positioned for substantial growth in the near future.
Understanding the GF Score
The GF Score is a stock performance ranking system developed by GuruFocus using five aspects of valuation, which has been found to be closely correlated to the long-term performances of stocks by backtesting from 2006 to 2021. The stocks with a higher GF Score generally generate higher returns than those with a lower GF Score. Therefore, when picking stocks, investors should invest in companies with high GF Scores. The GF Score ranges from 0 to 100, with 100 as the highest rank.
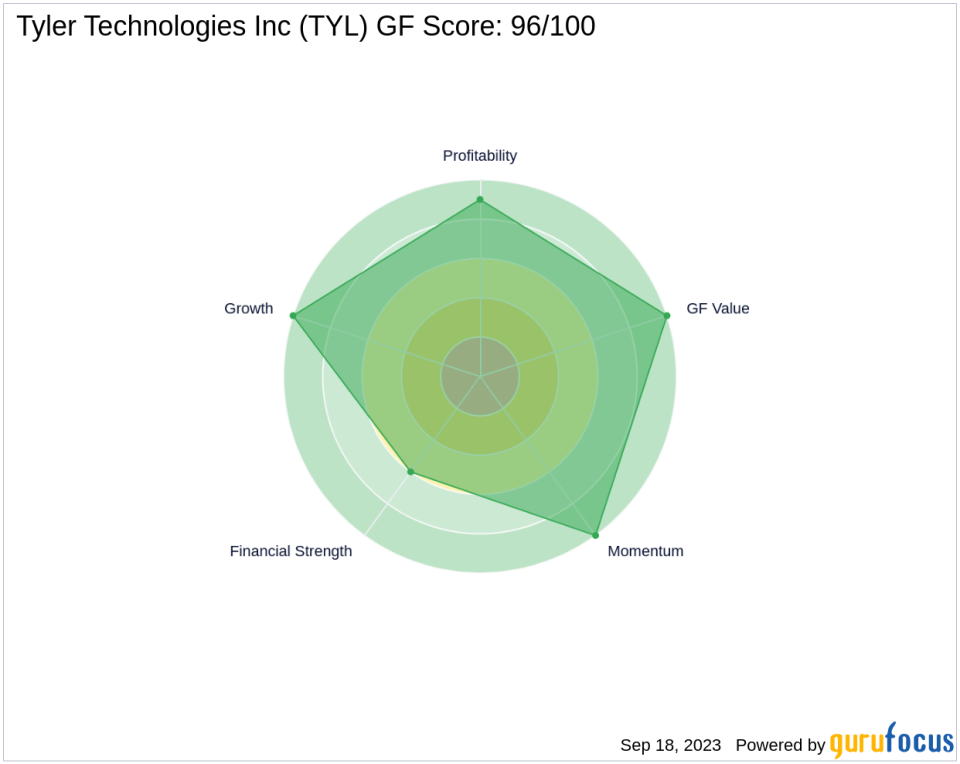
Here is a breakdown of Tyler Technologies Inc's GF Score:
Financial strength rank: 6/10
Profitability rank: 9/10
Growth rank: 10/10
GF Value rank: 10/10
Momentum rank: 10/10
Each one of these components is ranked and the ranks also have positive correlation with the long term performances of stocks. The GF score is calculated using the five key aspects of analysis. Through backtesting, we know that each of these key aspects has a different impact on the stock price performance. Thus, they are weighted differently when calculating the total score. With high ranks in profitability, growth, GF value, and momentum, and a decent rank in financial strength, GuruFocus assigned Tyler Technologies Inc the GF Score of 96 out of 100, which signals the highest outperformance potential.
Snapshot of Tyler Technologies Inc's Business
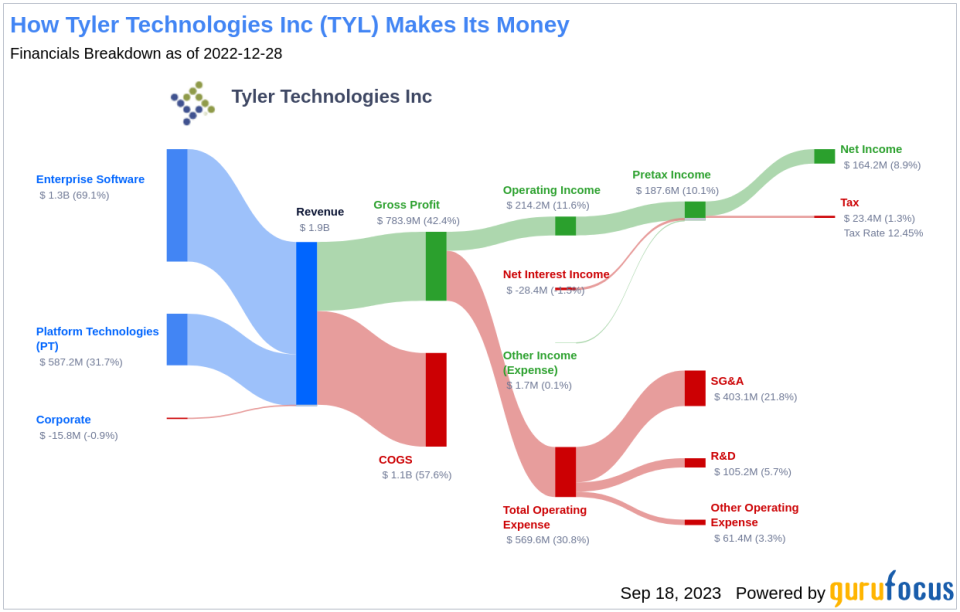
Tyler Technologies Inc, with a market cap of $16.14 billion, is a leading provider of software solutions and services that address the needs of cities, counties, schools, courts, and other local government entities. The company's core products include Munis, the core ERP system, Odyssey, the court management system, and payments. Tyler Technologies Inc also provides a variety of add-on modules and offers outsourced property tax assessment services. The company's sales stand at $1.9 billion, with an operating margin of 10.96%.
Financial Strength Breakdown
According to the Financial Strength rating, Tyler Technologies Inc's robust balance sheet exhibits resilience against financial volatility, reflecting prudent management of capital structure. The Interest Coverage ratio for Tyler Technologies Inc stands impressively at 6.63, underscoring its strong capability to cover its interest obligations. With an Altman Z-Score of 6.18, Tyler Technologies Inc exhibits a strong defense against financial distress. With a favorable Debt-to-Revenue ratio of 0.49, Tyler Technologies Inc's strategic handling of debt solidifies its financial health.
Profitability Rank Breakdown
The Profitability Rank shows Tyler Technologies Inc's impressive standing among its peers in generating profit. Tyler Technologies Inc's strong Predictability Rank of 4.5 stars out of five underscores its consistent operational performance, providing investors with increased confidence.
Growth Rank Breakdown
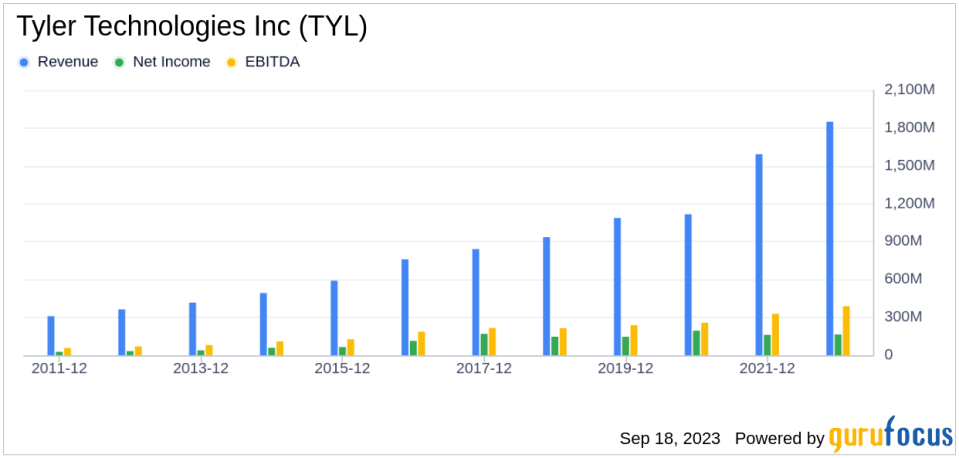
Ranked highly in Growth, Tyler Technologies Inc demonstrates a strong commitment to expanding its business. The company's 3-Year Revenue Growth Rate is 17.2%, which outperforms better than 69.95% of 2413 companies in the Software industry. Moreover, Tyler Technologies Inc has seen a robust increase in its earnings before interest, taxes, depreciation, and amortization (EBITDA) over the past few years. Specifically, the three-year growth rate stands at 15.4, and the rate over the past five years is 11.2. This trend accentuates the company's continued capability to drive growth.
Conclusion
Given Tyler Technologies Inc's strong financial strength, profitability, and growth metrics, the GuruFocus Score Rating highlights the firm's unparalleled position for potential outperformance. This analysis underscores the company's robust financial health and growth potential, making it a compelling investment opportunity for value investors. GuruFocus Premium members can find more companies with strong GF Scores using the following screener link: GF Score Screen
This article first appeared on GuruFocus.
