Unpacking the Investment Potential of YETI Holdings Inc (YETI): A Deep Dive into Key Financial ...
YETI Holdings Inc (NYSE:YETI) has recently been in the spotlight, drawing interest from investors and financial analysts due to its robust financial stance. With shares currently priced at $40.91, YETI Holdings Inc has witnessed a daily loss of 7.59%, marked against a three-month change of 7.14%. A thorough analysis, underlined by the GF Score, suggests that YETI Holdings Inc is well-positioned for substantial growth in the near future.
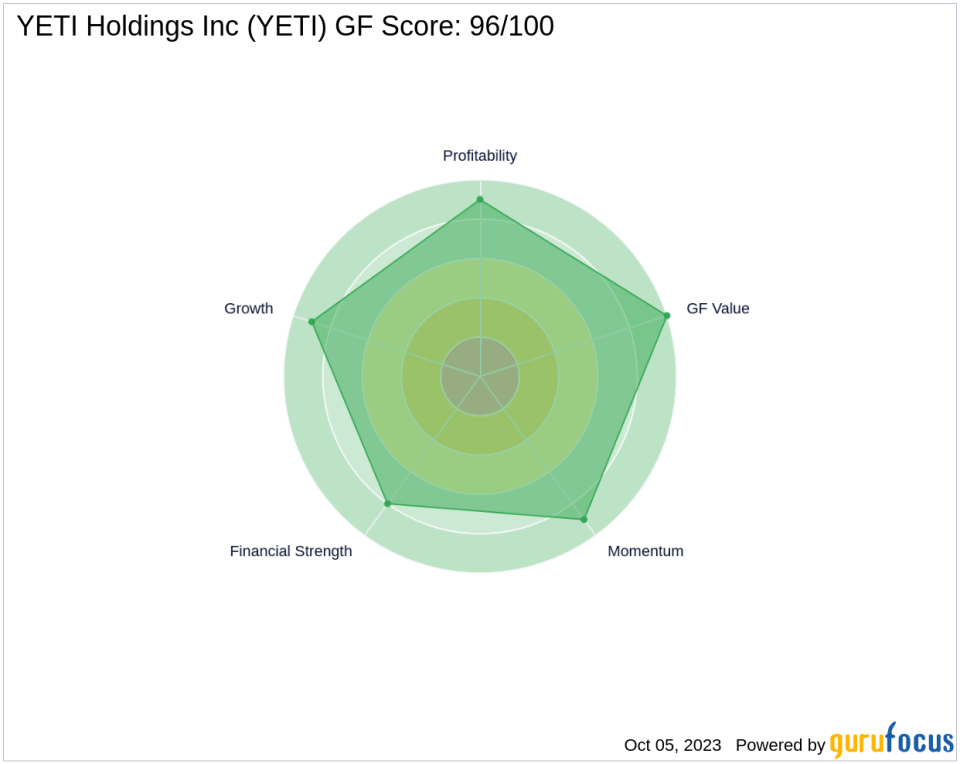
Decoding the GF Score
The GF Score is a stock performance ranking system developed by GuruFocus using five aspects of valuation, which has been found to be closely correlated to the long-term performances of stocks by backtesting from 2006 to 2021. The stocks with a higher GF Score generally generate higher returns than those with a lower GF Score. Therefore, when picking stocks, investors should invest in companies with high GF Scores. The GF Score ranges from 0 to 100, with 100 as the highest rank.
YETI Holdings Inc has been assigned the following ranks:
Financial strength rank: 8/10
Profitability rank: 9/10
Growth rank: 9/10
GF Value rank: 10/10
Momentum rank: 9/10
Each one of these components is ranked and the ranks also have positive correlation with the long term performances of stocks. The GF score is calculated using the five key aspects of analysis. Through backtesting, we know that each of these key aspects has a different impact on the stock price performance. Thus, they are weighted differently when calculating the total score. With high ranks across all categories, GuruFocus assigned YETI Holdings Inc the GF Score of 96 out of 100, which signals the highest outperformance potential.
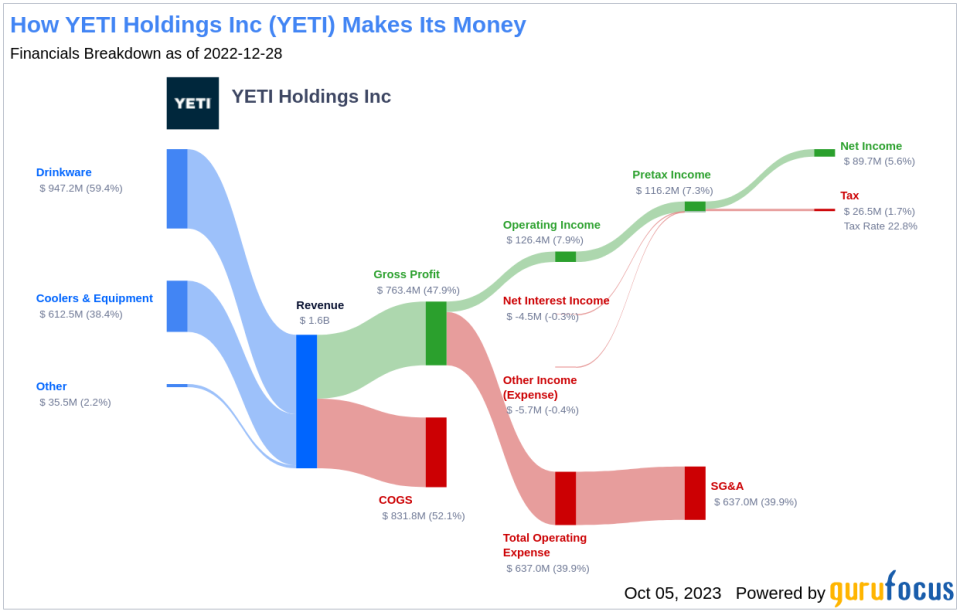
Understanding YETI Holdings Inc's Business
YETI Holdings Inc, with a market cap of $3.55 billion and sales of $1.59 billion, is a designer, marketer, and distributor of premium products for the outdoor and recreation market sold under the YETI brand. The company offers products including coolers and equipment, drinkware, and other accessories. Its trademark products include YETI, Tundra, Hopper, YETI TANK, Rambler, Colster, Rambler Colster, Roadie, and Wildly Stronger! Keep Ice Longer!, SideKick, FatWall, PermaFrost, T-Rex, ColdLock, NeverFail, AnchorPoint, InterLock, BearFoot, Vortex, DoubleHaul, LipGrip, Vortex, DryHide, ColdCell, HydroLock, Over-the-Nose, and LOAD-AND-LOCK. The company distributes products through wholesale channels and through direct-to-consumer, or DTC, channels.
Financial Strength Breakdown
According to the Financial Strength rating, YETI Holdings Inc's robust balance sheet exhibits resilience against financial volatility, reflecting prudent management of capital structure.
The Interest Coverage ratio for YETI Holdings Inc stands impressively at 22.18, underscoring its strong capability to cover its interest obligations. This robust financial position resonates with the wisdom of legendary investor Benjamin Graham, who favored companies with an interest coverage ratio of at least 5.
With an Altman Z-Score of 7.19, YETI Holdings Inc exhibits a strong defense against financial distress, highlighting its robust financial stability.
With a favorable Debt-to-Revenue ratio of 0.1, YETI Holdings Inc's strategic handling of debt solidifies its financial health.
Profitability Rank Breakdown
The Profitability Rank shows YETI Holdings Inc's impressive standing among its peers in generating profit.
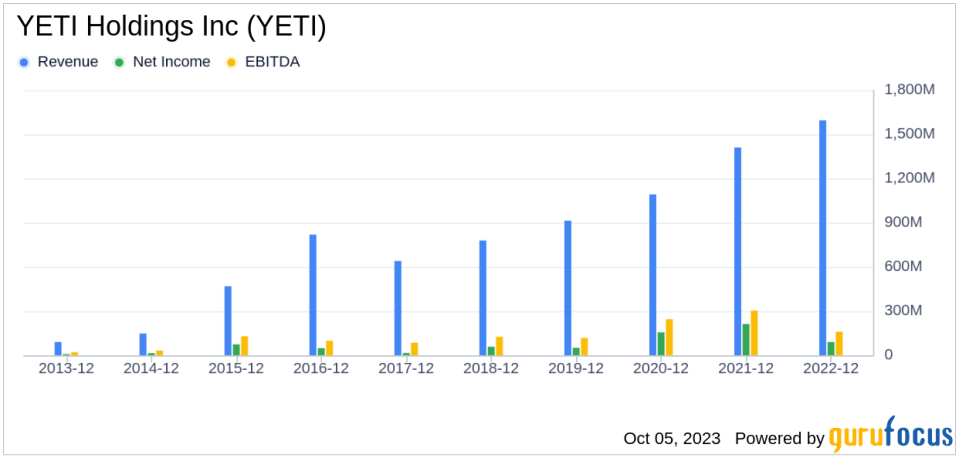
Growth Rank Breakdown
Ranked highly in Growth, YETI Holdings Inc demonstrates a strong commitment to expanding its business.
The company's 3-Year Revenue Growth Rate is 20%, which outperforms better than 88.67% of 759 companies in the Travel & Leisure industry
Moreover, YETI Holdings Inc has seen a robust increase in its earnings before interest, taxes, depreciation, and amortization (EBITDA) over the past few years. Specifically, the three-year growth rate stands at 10.4, and the rate over the past five years is 19.1. This trend accentuates the company's continued capability to drive growth.
Conclusion
Given the company's robust financial strength, impressive profitability, and strong growth metrics, the GF Score highlights YETI Holdings Inc's unparalleled position for potential outperformance. This analysis underscores the importance of comprehensive financial evaluation in making informed investment decisions.
GuruFocus Premium members can find more companies with strong GF Scores using the following screener link: GF Score Screen
This article first appeared on GuruFocus.
