Unraveling Bilibili Inc (BILI)'s Potential Performance Challenges: A Deep Dive into Key Metrics
Long-established in the Interactive Media industry, Bilibili Inc (NASDAQ:BILI) has enjoyed a stellar reputation. It has recently witnessed a daily gain of 5.3%, juxtaposed with a three-month change of -3.1%. However, fresh insights from the GF Score hint at potential headwinds. Notably, its diminished rankings in financial strength, growth, and valuation suggest that the company might not live up to its historical performance. Join us as we dive deep into these pivotal metrics to unravel the evolving narrative of Bilibili Inc.
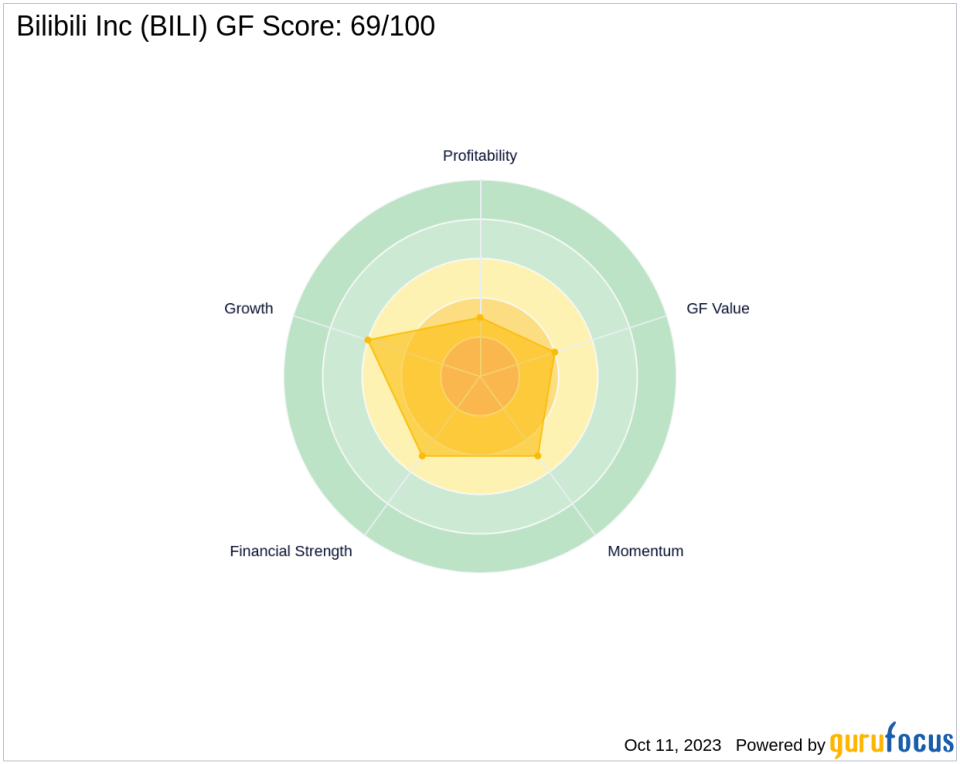
Decoding the GF Score
The GF Score is a stock performance ranking system developed by GuruFocus using five aspects of valuation, which has been found to be closely correlated to the long-term performances of stocks by backtesting from 2006 to 2021. The stocks with a higher GF Score generally generate higher returns than those with a lower GF Score. Therefore, when picking stocks, investors should invest in companies with high GF Scores. The GF Score ranges from 0 to 100, with 100 as the highest rank.
Financial strength rank: 5/10
Profitability rank: 3/10
Growth rank: 6/10
GF Value rank: 4/10
Momentum rank: 5/10
Based on the above method, GuruFocus assigned Bilibili Inc the GF Score of 69 out of 100, which signals poor future outperformance potential.
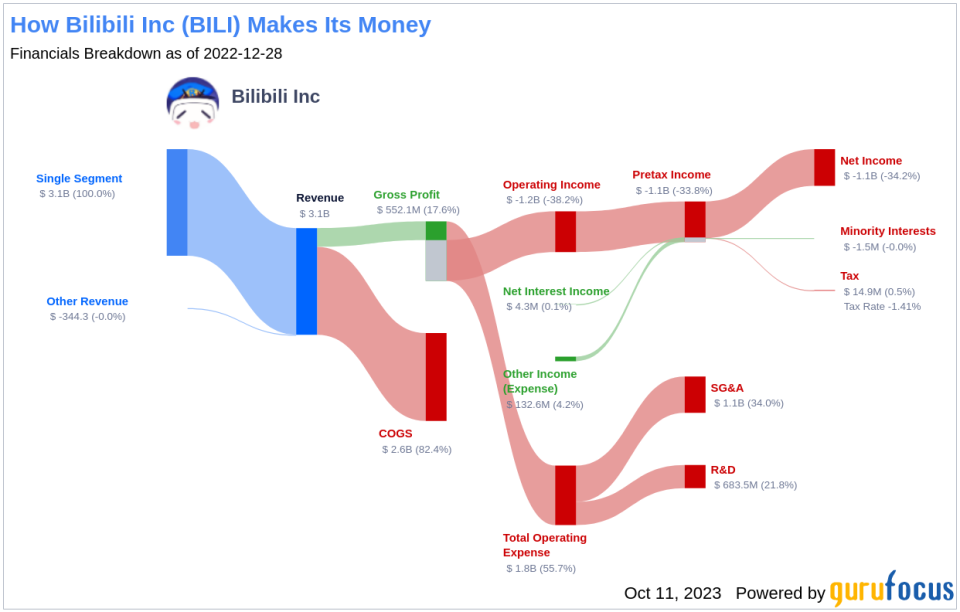
Understanding Bilibili Inc's Business
Bilibili Inc, with a market cap of $6.21 billion, is a Chinese online entertainment platform best known for its video-sharing site that resembles YouTube. Founded in 2009, the site started as a long-form video platform for anime, comics, and gaming, or ACG, content that appealed to Gen Z users. Since then, it has expanded its content on the platform to include a broader range of interests that have attracted Chinese users outside of the Gen Z cohort. The firm generates revenue through five main areas: advertising, games, live streaming, value-added services, and e-commerce. With sales of $3.18 billion, the company has an operating margin of -30.64%.
Financial Strength Breakdown
Bilibili Inc's financial strength indicators present some concerning insights about the company's balance sheet health. Bilibili Inc has an interest coverage ratio of 0, which positions it worse than 0% of 326 companies in the Interactive Media industry. This ratio highlights potential challenges the company might face when handling its interest expenses on outstanding debt. It's worth noting that the esteemed investor Benjamin Graham typically favored companies with an interest coverage ratio of at least five.
The company's Altman Z-Scoreis just 0.64, which is below the distress zone of 1.81. This suggests that the company may face financial distress over the next few years.
Profitability Breakdown
Bilibili Inc's low Profitability rank can also raise warning signals. Bilibili Inc's Operating Margin has declined over the past five years ((-205,104.00%)), as shown by the following data: 2018: -17.66; 2019: -22.06; 2020: -26.18; 2021: -33.17; 2022: -38.17.
Additionally, Bilibili Inc's Gross Margin has also declined over the past five years, as evidenced by the data: 2018: 20.72; 2019: 17.56; 2020: 23.67; 2021: 20.86; 2022: 17.58. This trend underscores the company's struggles to convert its revenue into profits.
Next Steps
Given Bilibili Inc's financial strength, profitability, and growth metrics, the GF Score highlights the firm's unparalleled position for potential underperformance. While the company has a strong reputation in the Interactive Media industry, these metrics suggest that it may face significant challenges in maintaining its historical performance. As value investors, it's crucial to consider these factors when making investment decisions.
GuruFocus Premium members can find more companies with strong GF Scores using the following screener link: GF Score Screen
This article, generated by GuruFocus, is designed to provide general insights and is not tailored financial advice. Our commentary is rooted in historical data and analyst projections, utilizing an impartial methodology, and is not intended to serve as specific investment guidance. It does not formulate a recommendation to purchase or divest any stock and does not consider individual investment objectives or financial circumstances. Our objective is to deliver long-term, fundamental data-driven analysis. Be aware that our analysis might not incorporate the most recent, price-sensitive company announcements or qualitative information. GuruFocus holds no position in the stocks mentioned herein.
This article first appeared on GuruFocus.
