Unraveling the Challenges Ahead for Carnival PLC (CUK): A Deep Dive into Key Metrics
Long-established in the Travel & Leisure industry, Carnival PLC (NYSE:CUK) has enjoyed a stellar reputation. However, it has recently witnessed a daily loss of 6.29%, juxtaposed with a three-month change of -33.6%. Fresh insights from the GF Score hint at potential headwinds. Notably, its diminished rankings in financial strength, growth, and valuation suggest that the company might not live up to its historical performance. Join us as we dive deep into these pivotal metrics to unravel the evolving narrative of Carnival PLC.
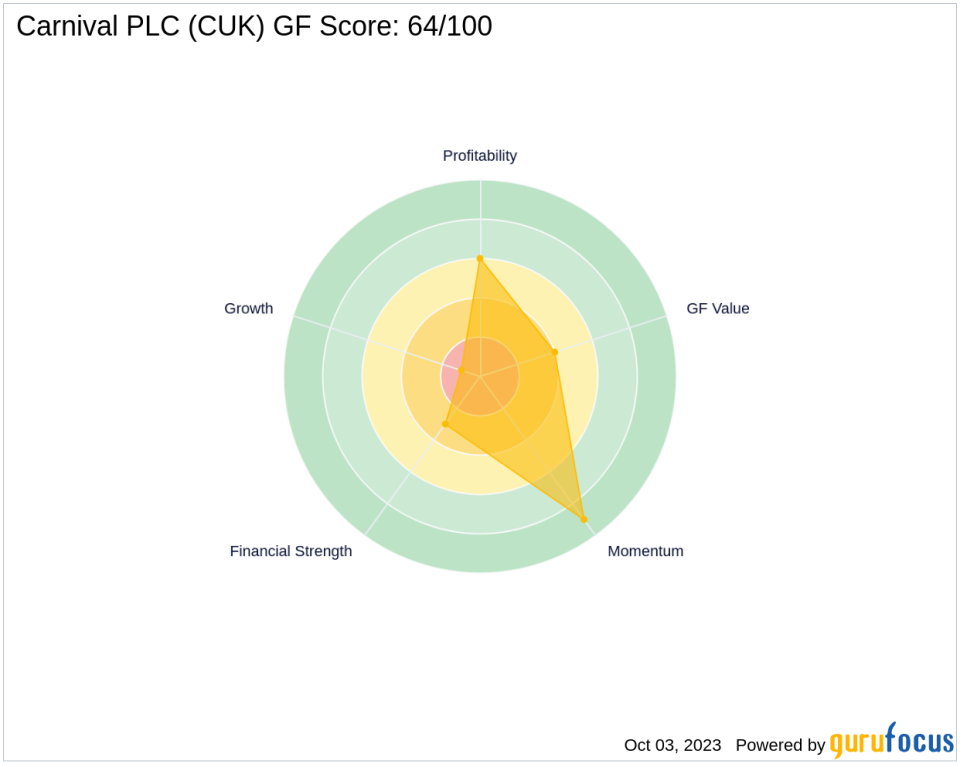
Decoding the GF Score
The GF Score is a stock performance ranking system developed by GuruFocus using five aspects of valuation, which has been found to be closely correlated to the long-term performances of stocks by backtesting from 2006 to 2021. The stocks with a higher GF Score generally generate higher returns than those with a lower GF Score. Therefore, when picking stocks, investors should invest in companies with high GF Scores. The GF Score ranges from 0 to 100, with 100 as the highest rank.
Financial strength rank: 3/10
Profitability rank: 6/10
Growth rank: 1/10
GF Value rank: 4/10
Momentum rank: 9/10
Based on the above method, GuruFocus assigned Carnival PLC the GF Score of 64 out of 100, which signals poor future outperformance potential.
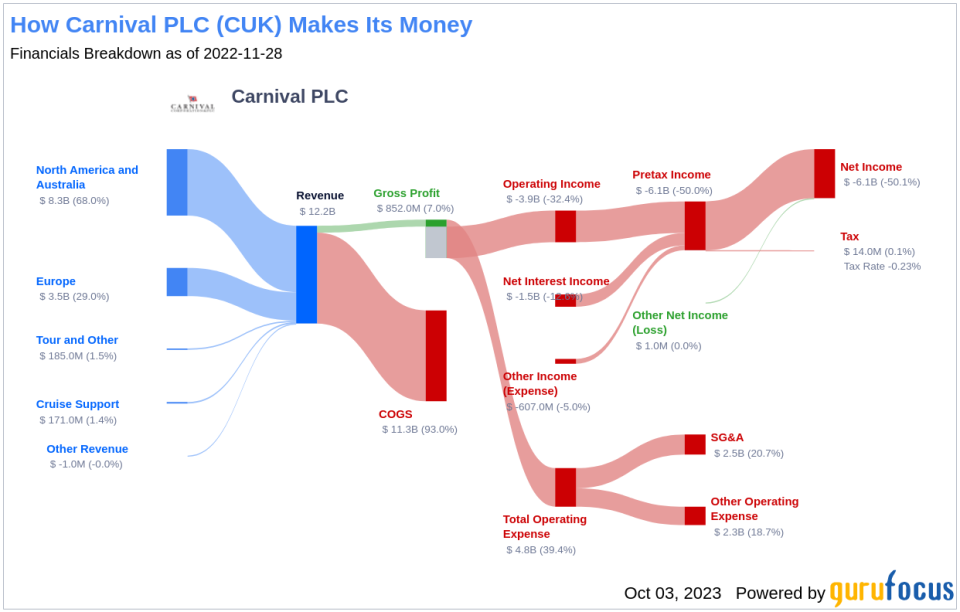
Understanding Carnival PLC's Business
Carnival PLC, with a market cap of $1.72 billion and sales of $20.04 billion, operates as the largest global cruise company. It boasts an operating margin of 3.89%. Its portfolio of brands includes Carnival Cruise Lines, Holland America, Princess Cruises, and Seabourn in North America; P&O Cruises and Cunard Line in the United Kingdom; Aida in Germany; Costa Cruises in Southern Europe; and P&O Cruises in Australia. Carnival also owns Holland America Princess Alaska Tours in Alaska and the Canadian Yukon. Prior to COVID-19, Carnival's brands attracted about 13 million guests in 2019, a level it should breach again in 2023.
Financial Strength Breakdown
Carnival PLC's financial strength indicators present some concerning insights about the company's balance sheet health. The company's interest coverage ratio of 0.38 positions it worse than 93.81% of 565 companies in the Travel & Leisure industry. This ratio highlights potential challenges the company might face when handling its interest expenses on outstanding debt. It's worth noting that the esteemed investor Benjamin Graham typically favored companies with an interest coverage ratio of at least five.
The company's Altman Z-Score is just 0.32, which is below the distress zone of 1.81. This suggests that the company may face financial distress over the next few years. Additionally, the company's low cash-to-debt ratio at 0.09 indicates a struggle in handling existing debt levels. The company's debt-to-equity ratio is 4.69, which is worse than 92.76% of 663 companies in the Travel & Leisure industry. A high debt-to-equity ratio suggests over-reliance on borrowing and vulnerability to market fluctuations. Additionally, the company's debt-to-Ebitda ratio is 11.86, which is above Joel Tillinghast's warning level of 4 and is worse than 86.75% of 581 companies in the Travel & Leisure industry. Tillinghast said in his book Big Money Think's Small: Biases, Blind Spots, and Smarter Investing that a high debt-to-Ebitda ratio can be a red flag unless tangible assets cover the debt.
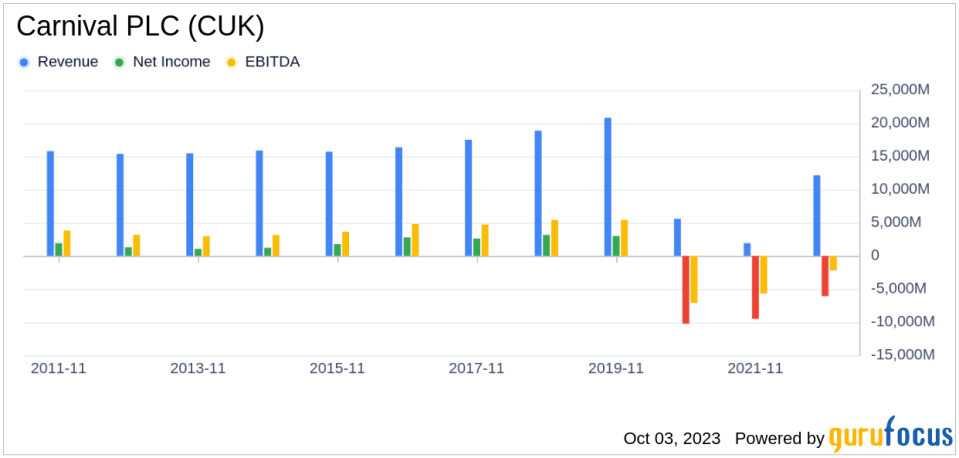
Growth Prospects
A lack of significant growth is another area where Carnival PLC seems to falter, as evidenced by the company's low Growth rank. The company's revenue has declined by -27.8 per year over the past three years, which underperforms worse than 87.45% of 757 companies in the Travel & Leisure industry. Stagnating revenues may pose concerns in a fast-evolving market. Lastly, Carnival PLC predictability rank is just one star out of five, adding to investor uncertainty regarding revenue and earnings consistency.
Conclusion
Given the company's financial strength, profitability, and growth metrics, the GF Score highlights the firm's unparalleled position for potential underperformance. While Carnival PLC has a rich history and a diverse portfolio of brands, its financial health and growth prospects raise concerns about its future performance. As value investors, it's crucial to consider these factors when making investment decisions.
GuruFocus Premium members can find more companies with strong GF Scores using the following screener link: GF Score Screen
This article first appeared on GuruFocus.
