Unraveling the Future of Cars.com Inc (CARS): A Deep Dive into Key Metrics
Long-established in the Vehicles & Parts industry, Cars.com Inc (NYSE:CARS) has enjoyed a stellar reputation. However, it has recently witnessed a decline of 5.06%, juxtaposed with a three-month change of -3.39%. Fresh insights from the GuruFocus Score Rating hint at potential headwinds. Notably, its diminished rankings in financial strength, growth, and valuation suggest that the company might not live up to its historical performance. Join us as we dive deep into these pivotal metrics to unravel the evolving narrative of Cars.com Inc.

Decoding the GF Score
The GF Score is a stock performance ranking system developed by GuruFocus using five aspects of valuation, which has been found to be closely correlated to the long-term performances of stocks by backtesting from 2006 to 2021. The stocks with a higher GF Score generally generate higher returns than those with a lower GF Score. Therefore, when picking stocks, investors should invest in companies with high GF Scores. The GF Score ranges from 0 to 100, with 100 as the highest rank.
Financial strength rank: 4/10
Profitability rank: 7/10
Growth rank: 1/10
GF Value rank: 3/10
Momentum rank: 6/10
Based on the above method, GuruFocus assigned Cars.com Inc the GF Score of 64 out of 100, which signals poor future outperformance potential.
Understanding Cars.com Inc Business
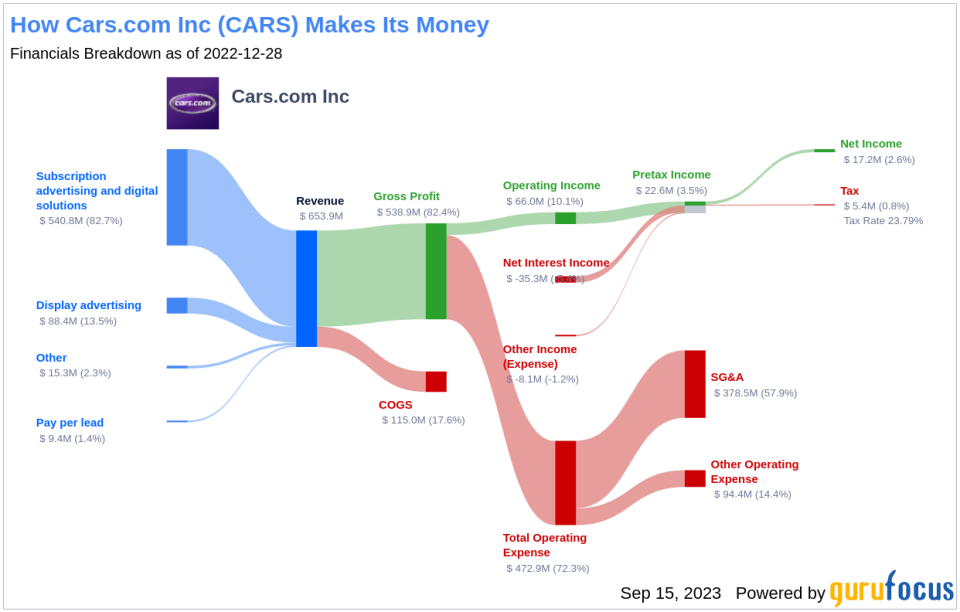
Cars.com Inc, with a market cap of $1.17 billion, is an online destination for buying and selling new and used vehicles. The company, which reported sales of $668.04 million, operates several brands including Dealer Inspire, DealerRater, FUEL, Accu-Trade, PickupTrucks.com, CreditIQ, and NewCars.com. These websites cater to different consumer segments, offering a wide range of services. Despite an operating margin of 9.67%, the company's recent performance has raised concerns about its future prospects.
Financial Strength Breakdown
Cars.com Inc's financial strength indicators present some concerning insights about the company's balance sheet health. The company has an interest coverage ratio of 1.94, which positions it worse than 84.15% of 978 companies in the Vehicles & Parts industry. This ratio highlights potential challenges the company might face when handling its interest expenses on outstanding debt. It's worth noting that the esteemed investor Benjamin Graham typically favored companies with an interest coverage ratio of at least five.
The company's Altman Z-Score is just 0.72, which is below the distress zone of 1.81. This suggests that the company may face financial distress over the next few years. Additionally, the company's low cash-to-debt ratio at 0.06 indicates a struggle in handling existing debt levels.
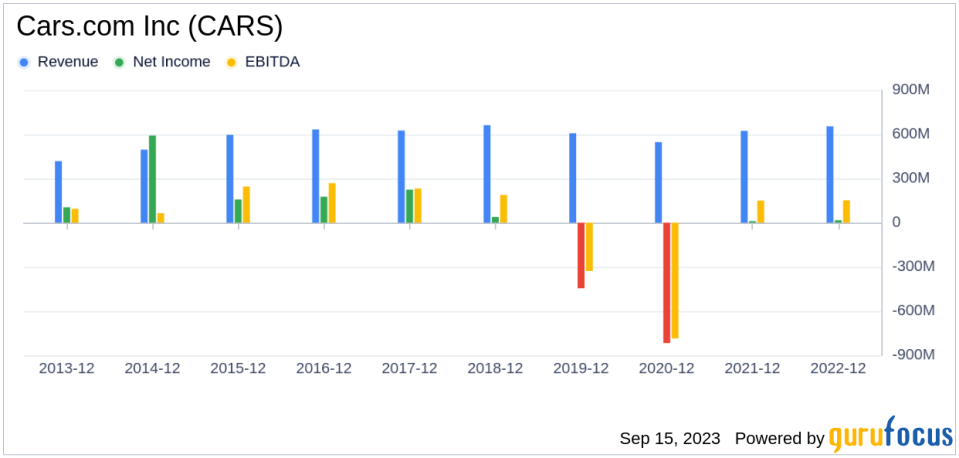
Growth Prospects
A lack of significant growth is another area where Cars.com Inc seems to falter, as evidenced by the company's low Growth rank.
Conclusion
Given the company's financial strength, profitability, and growth metrics, the GuruFocus Score Rating highlights the firm's unparalleled position for potential underperformance. While Cars.com Inc has a strong reputation in the industry, these indicators suggest that it may struggle to maintain its historical performance. As value investors, it's crucial to consider these factors when making investment decisions.
GuruFocus Premium members can find more companies with strong GF Scores using the following screener link: GF Score Screen
This article first appeared on GuruFocus.
