Unraveling NiSource Inc (NI): A Deep Dive into Its Performance Metrics
Long-established in the Utilities - Regulated industry, NiSource Inc (NYSE:NI) has enjoyed a stellar reputation. However, it has recently witnessed a daily loss of 3.53%, juxtaposed with a three-month change of -12.5%. Fresh insights from the GF Score hint at potential headwinds. Notably, its diminished rankings in financial strength, growth, and valuation suggest that the company might not live up to its historical performance. Join us as we dive deep into these pivotal metrics to unravel the evolving narrative of NiSource Inc.
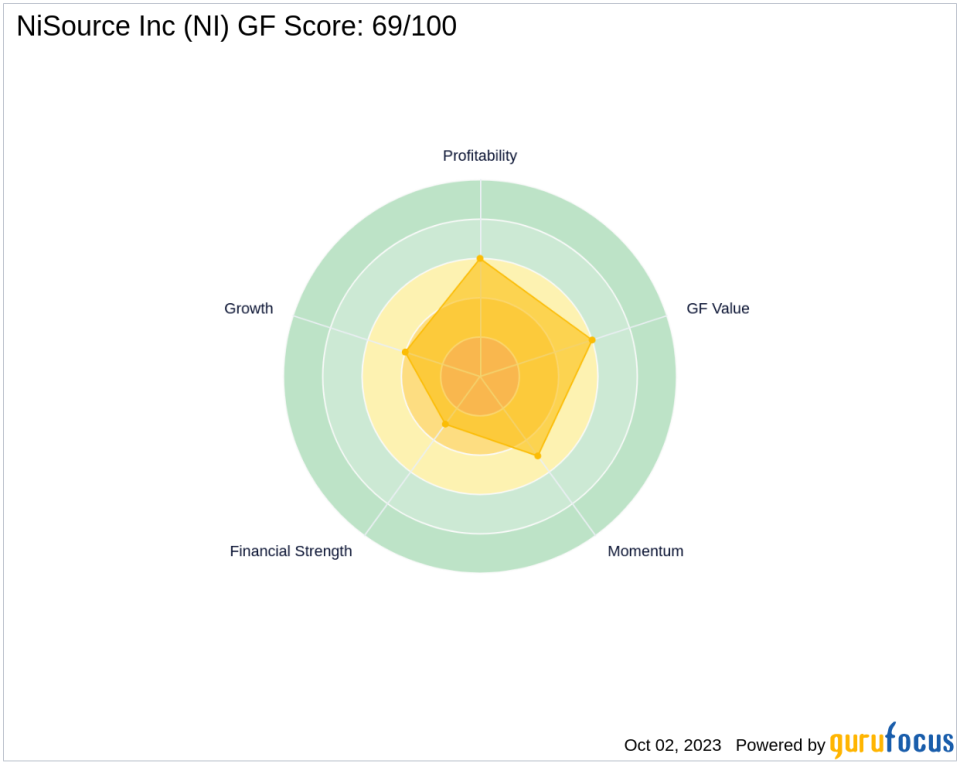
What Is the GF Score?
The GF Score is a stock performance ranking system developed by GuruFocus using five aspects of valuation, which has been found to be closely correlated to the long-term performances of stocks by backtesting from 2006 to 2021. The stocks with a higher GF Score generally generate higher returns than those with a lower GF Score. Therefore, when picking stocks, investors should invest in companies with high GF Scores. The GF Score ranges from 0 to 100, with 100 as the highest rank.
Financial strength rank: 3/10
Profitability rank: 6/10
Growth rank: 4/10
GF Value rank: 6/10
Momentum rank: 5/10
Based on the above method, GuruFocus assigned NiSource Inc the GF Score of 69 out of 100, which signals poor future outperformance potential.
Understanding NiSource Inc Business
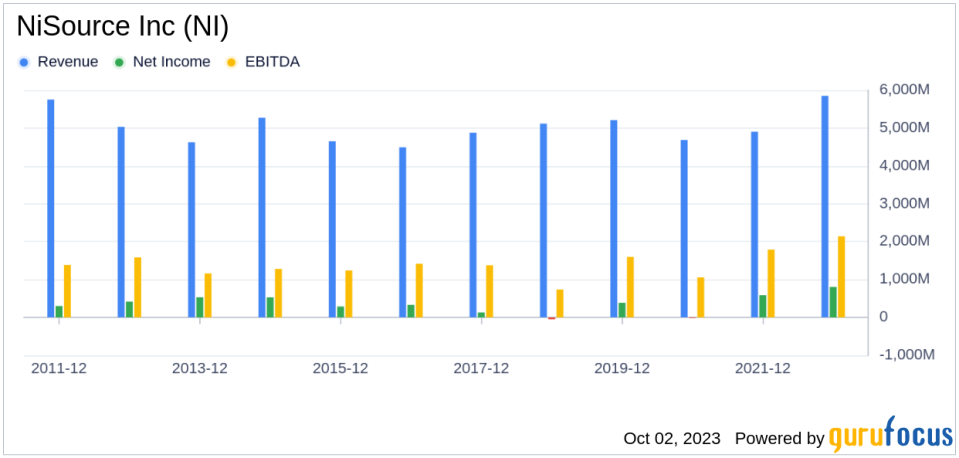
NiSource Inc is one of the nation's largest natural gas distribution companies, serving approximately 3.2 million customers across Indiana, Kentucky, Maryland, Ohio, Pennsylvania, and Virginia. The company's electric utility transmits and distributes electricity in northern Indiana to about 500,000 customers. The regulated electric utility also owns more than 3,000 megawatts of generation capacity, most of which is now coal-fired but is being replaced by natural gas and renewable energy. With a market cap of $9.84 billion and sales of $5.85 billion, the company has an operating margin of 20.9%.

Financial Strength Breakdown
NiSource Inc's financial strength indicators present some concerning insights about the company's balance sheet health. The company's interest coverage ratio of 2.97 positions it worse than 61.63% of 430 companies in the Utilities - Regulated industry. This ratio highlights potential challenges the company might face when handling its interest expenses on outstanding debt. The company's Altman Z-Score is just 0.52, which is below the distress zone of 1.81. This suggests that the company may face financial distress over the next few years. Additionally, the company's low cash-to-debt ratio at 0.01 indicates a struggle in handling existing debt levels. Furthermore, the company's debt-to-Ebitda ratio is 5.97, which is above Joel Tillinghast's warning level of 4 and is worse than 71.07% of 439 companies in the Utilities - Regulated industry.
Growth Prospects
A lack of significant growth is another area where NiSource Inc seems to falter, as evidenced by the company's low Growth rank. The company's revenue has declined by -1.6 per year over the past three years, which underperforms worse than 86.49% of 481 companies in the Utilities - Regulated industry. Stagnating revenues may pose concerns in a fast-evolving market. Lastly, NiSource Inc predictability rank is just one star out of five, adding to investor uncertainty regarding revenue and earnings consistency.
Conclusion
Given the company's financial strength, profitability, and growth metrics, the GF Score highlights NiSource Inc's unparalleled position for potential underperformance. While the company has a rich history in the Utilities - Regulated industry, its current financial health and growth prospects raise concerns about its ability to maintain its historical performance. As value investors, it's crucial to consider these factors when making investment decisions.
GuruFocus Premium members can find more companies with strong GF Scores using the following screener link: GF Score Screen
This article first appeared on GuruFocus.
