Unraveling the Potential Value Trap in Newell Brands Inc (NWL)
On July 26, 2023, Newell Brands Inc (NASDAQ:NWL) experienced a daily gain of 3.89%, despite a Loss Per Share of $-0.29. The question arises: Is this stock a potential value trap? This article aims to answer this question through an in-depth valuation analysis. Keep reading to gain valuable insights into Newell Brands and its current market status.
Company Snapshot
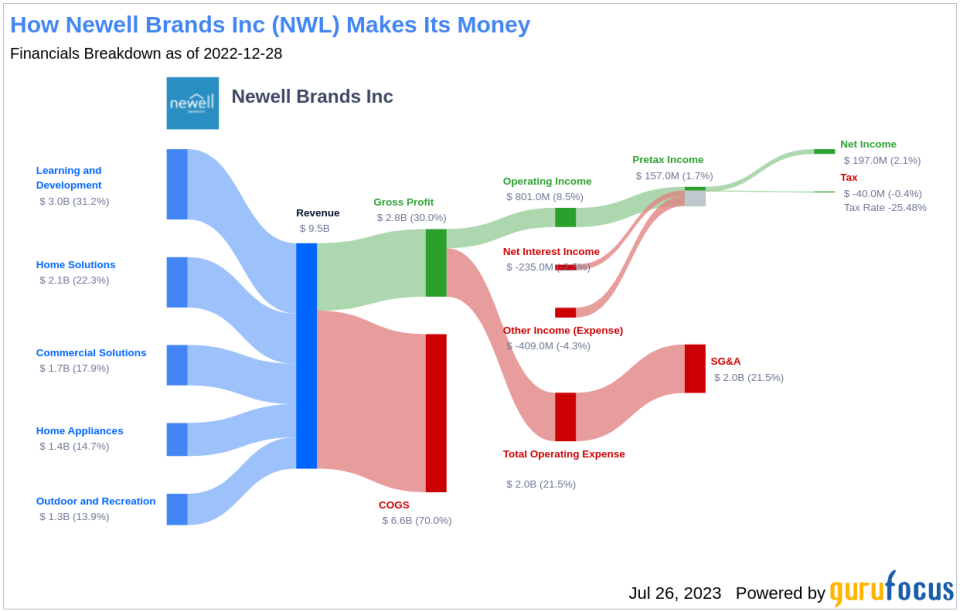
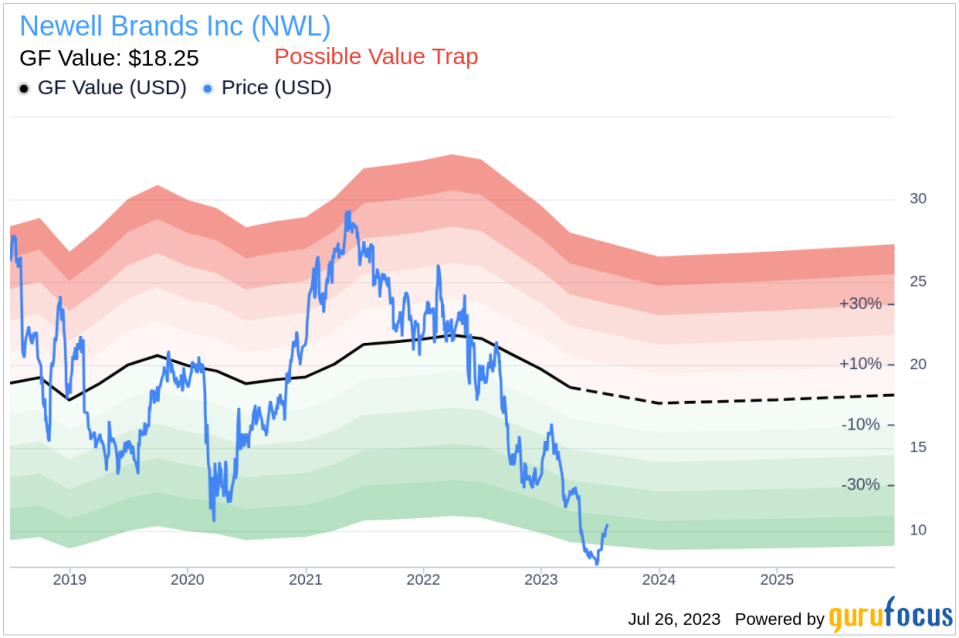
Newell Brands Inc is a renowned American consumer goods company. It operates through five segments: Commercial Solutions, Home Appliances, Home Solutions, Learning and Development, and Outdoor and Recreation. The majority of the company's revenue comes from the Learning and Development segment, which offers a range of products from baby gear and infant care products to writing instruments and art products. The company's stock price currently stands at $10.41, which we will compare to its GF Valuean estimation of fair valueto assess the company's intrinsic value.
Understanding GF Value
The GF Value is a unique measure of a stock's intrinsic value, calculated based on historical trading multiples, a GuruFocus adjustment factor, and future business performance estimates. The GF Value Line provides an overview of the fair value at which the stock should ideally trade. If the stock price is significantly above the GF Value Line, it is considered overvalued, and its future return is likely to be poor. Conversely, if the stock price is significantly below the GF Value Line, its future return will likely be higher.
According to GuruFocus' valuation method, Newell Brands (NASDAQ:NWL) might be a potential value trap due to poor financial strength metrics. With its current price of $10.41 per share, investors should think twice before investing.
Financial Strength
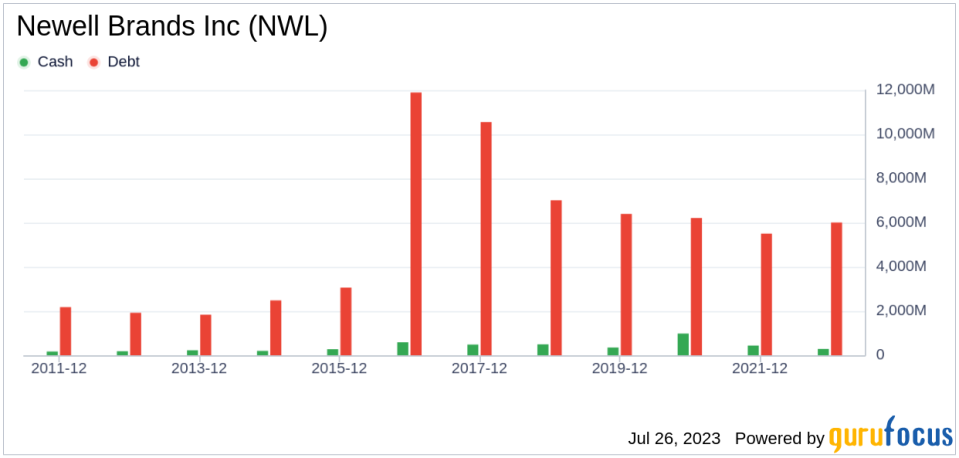
Investing in companies with low financial strength could lead to permanent capital loss. Therefore, it's crucial to review a company's financial strength before deciding to buy shares. Newell Brands has a cash-to-debt ratio of 0.04, ranking worse than 89.04% of companies in the Consumer Packaged Goods industry. Based on this, GuruFocus ranks Newell Brands's financial strength as 4 out of 10, indicating a poor balance sheet.
Profitability and Growth
Newell Brands has been profitable 8 out of the past 10 years. Over the past twelve months, the company had sales of $8.9 billion and a Loss Per Share of $0.29. Its operating margin is 6.55%, ranking better than 60.78% of companies in the Consumer Packaged Goods industry. However, Newell Brands's 3-year average revenue growth rate is worse than 72.47% of companies in the industry, and its 3-year average EBITDA growth rate is 0%.
ROIC vs WACC
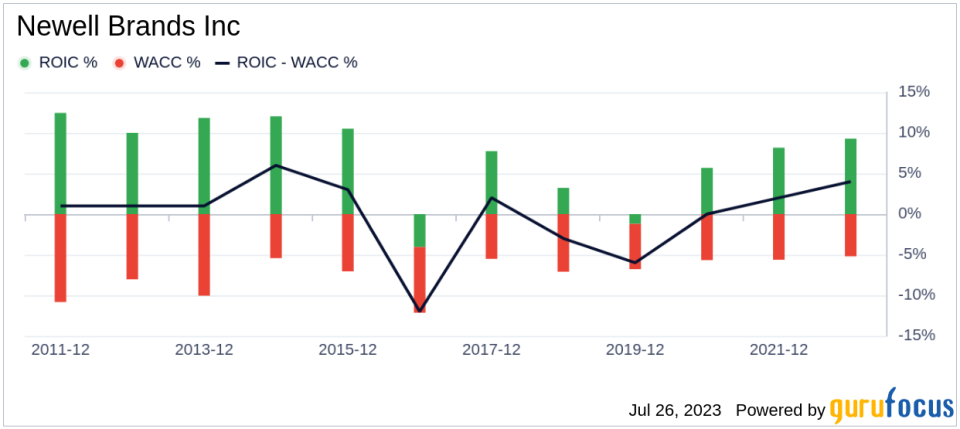
Comparing a company's return on invested capital (ROIC) and the weighted cost of capital (WACC) is another way to assess its profitability. Over the past 12 months, Newell Brands's ROIC was 3.03, and its WACC was 5.84.
Identifying a Value Trap
The potential value trap in Newell Brands is indicated by a low Piotroski F-score of 2 out of 9, indicating potential downward trends in profitability, funding, and efficiency. Moreover, the company's Altman Z-score stands at 0.73, placing it in the distress zone and signaling an increased bankruptcy risk.
Conclusion
In conclusion, Newell Brands (NASDAQ:NWL) appears to be a potential value trap. Despite its fair profitability, the company's financial condition is poor, and its growth ranks worse than 0% of companies in the Consumer Packaged Goods industry. For more details on Newell Brands stock, check out its 30-Year Financials here.
To discover high-quality companies that may deliver above-average returns, consider checking out GuruFocus High Quality Low Capex Screener.
This article first appeared on GuruFocus.
