Unraveling WeTrade Group Inc's Potential for Underperformance: A Deep Dive into Key Metrics
Long-established in the Software industry, WeTrade Group Inc (NASDAQ:WETG) has enjoyed a stellar reputation. It has recently witnessed a surge of 15.51%, juxtaposed with a three-month change of 2.1%. However, fresh insights from the GuruFocus Score Rating hint at potential headwinds. Notably, its diminished rankings in financial strength, growth, and valuation suggest that the company might not live up to its historical performance. Join us as we dive deep into these pivotal metrics to unravel the evolving narrative of WeTrade Group Inc.
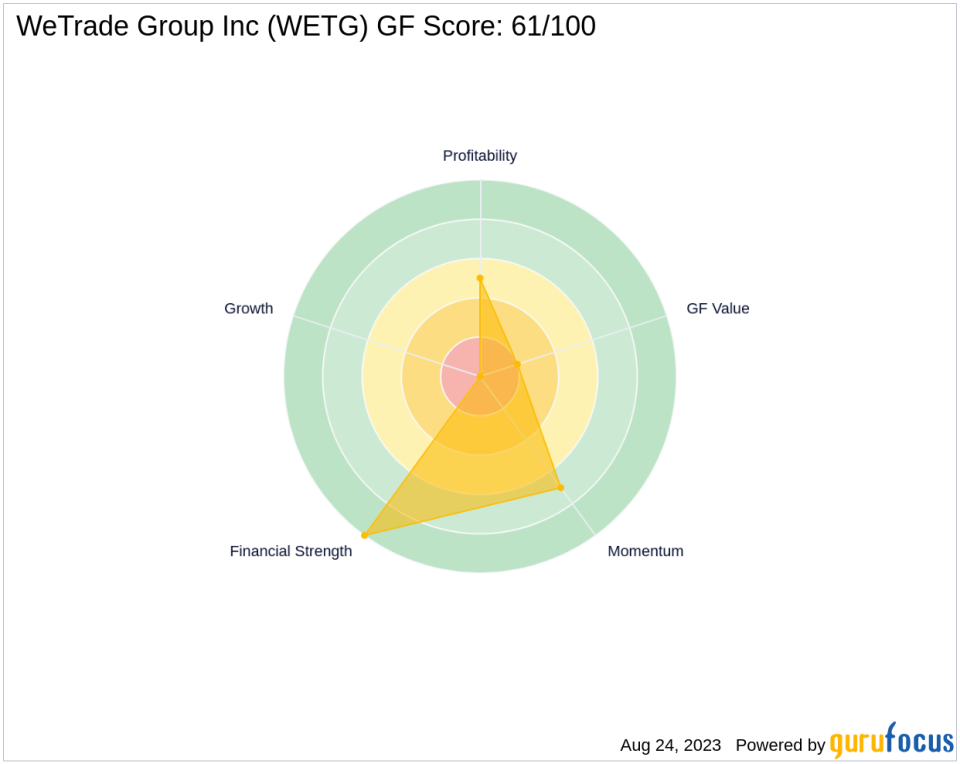
Understanding the GF Score
The GF Score is a stock performance ranking system developed by GuruFocus using five aspects of valuation, which has been found to be closely correlated to the long-term performances of stocks by backtesting from 2006 to 2021. The stocks with a higher GF Score generally generate higher returns than those with a lower GF Score. Therefore, when picking stocks, investors should invest in companies with high GF Scores. The GF Score ranges from 0 to 100, with 100 as the highest rank.
1. Financial strength rank: 10/10
2. Profitability rank: 5/10
3. Growth rank: 0/10
4. GF Value rank: 2/10
5. Momentum rank: 7/10
Based on the above method, GuruFocus assigned WeTrade Group Inc the GF Score of 61 out of 100, which signals poor future outperformance potential.
Snapshot of WeTrade Group Inc's Business
WeTrade Group Inc is engaged in providing technical services and solutions via its membership-based social e-commerce platform and chatGPT technical services. The company provides technology services to both individual and corporate users. It offers an international cloud-based intelligence system and independently developed a micro-business cloud intelligence system called the YCloud. The company also serves tourism, hospitality, livestreaming and short video, medical beauty, and traditional retail industries. With a market cap of $8.64 billion and sales of $8.44 billion, the company's operating margin stands at -141.55%.
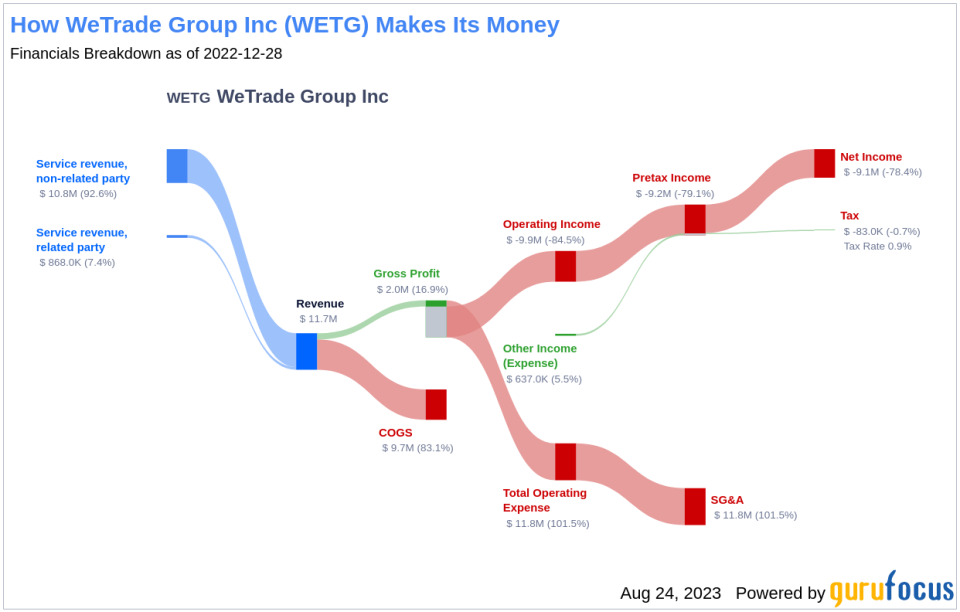
Profitability Breakdown
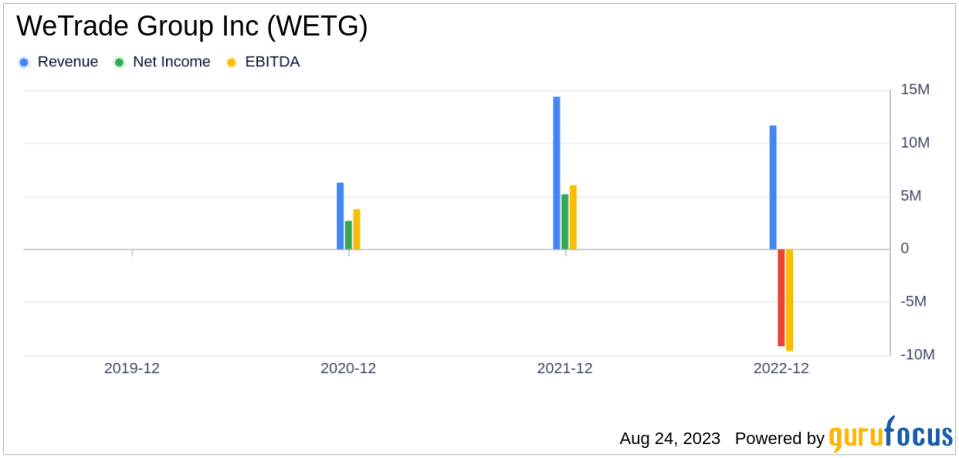
WeTrade Group Inc's low Profitability rank can also raise warning signals. The company's Operating Margin has declined over the past five years ((-845,429.00%)), as shown by the following data: 2019: 0; 2020: 59.87; 2021: 41.68; 2022: -84.54; .
Growth Prospects
A lack of significant growth is another area where WeTrade Group Inc seems to falter, as evidenced by the company's low Growth rank. The company's revenue has declined by 0 per year over the past three years, which underperforms worse than 0% of 2391 companies in the Software industry. Stagnating revenues may pose concerns in a fast-evolving market.
Conclusion
Given the company's financial strength, profitability, and growth metrics, the GuruFocus Score Rating highlights the firm's unparalleled position for potential underperformance. While WeTrade Group Inc has a strong reputation in the software industry, its declining operating margin and stagnant revenue growth suggest that it may struggle to maintain its historical performance. Investors should consider these factors when making investment decisions.
GuruFocus Premium members can find more companies with strong GF Scores using the following screener link: GF Score Screen
This article first appeared on GuruFocus.
