Unveiling Axonics (AXNX)'s True Worth: A Comprehensive Guide to Its Market Value
Despite a daily loss of 5.03% and a 3-month gain of 18.51%, Axonics Inc (NASDAQ:AXNX) recorded a Loss Per Share of 0.67. This raises the question - is the stock significantly undervalued? In this article, we will conduct a thorough valuation analysis of Axonics to answer this question. So, let's dive in.
Company Introduction
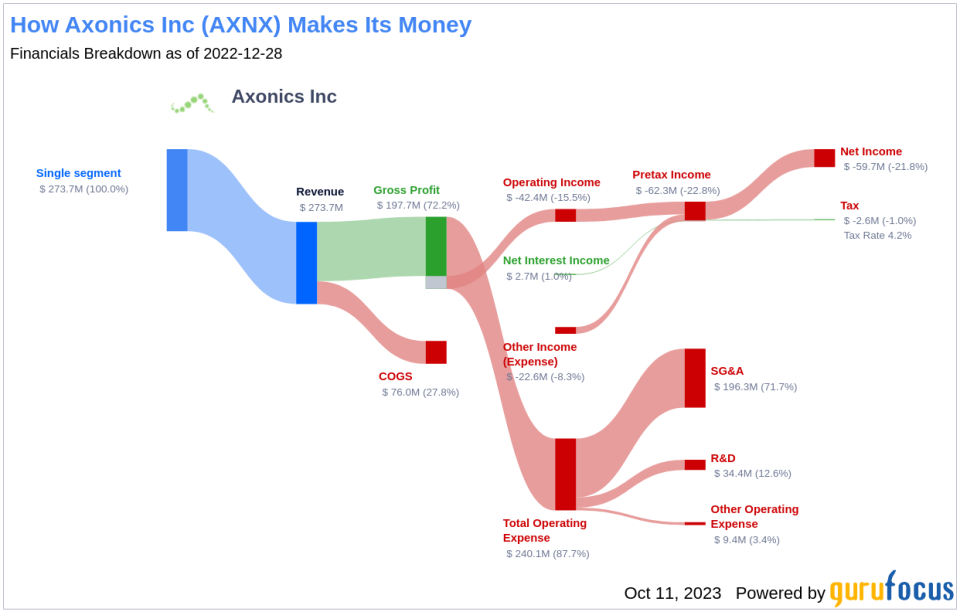
Axonics Inc, a United States-based medical technology company, specializes in developing and commercializing novel products for adults with bladder and bowel dysfunction. These include implantable SNM systems for treating urinary urge incontinence and urinary urgency frequency (UUF), and a urethral bulking agent (Bulkamid) for treating female stress urinary incontinence. SNM therapy is primarily used to treat patients with overactive bladder, fecal incontinence, and urinary retention.
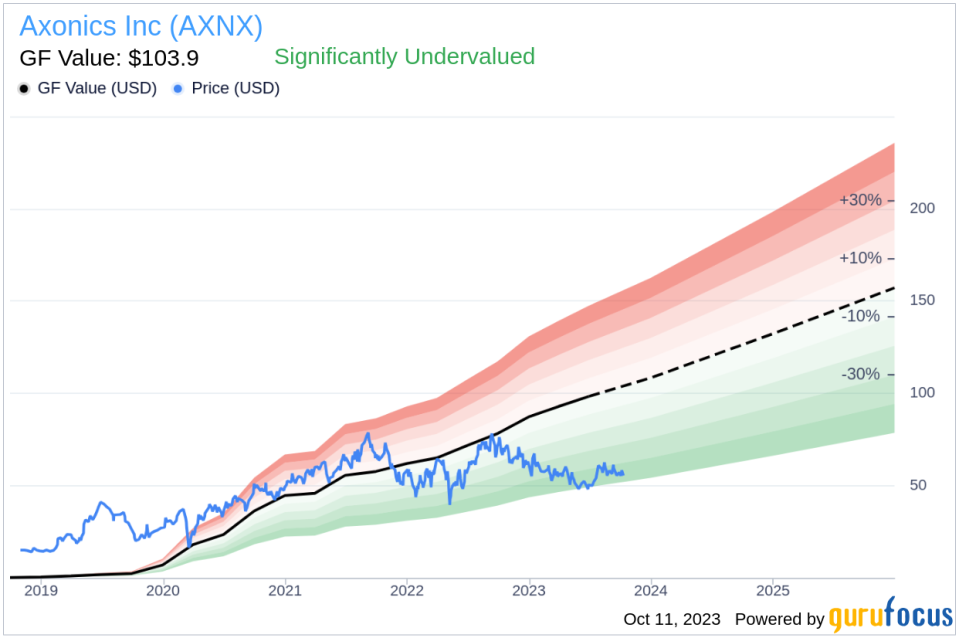
Currently, Axonics (NASDAQ:AXNX) trades at $56.17 per share. However, according to the GF Value, an estimation of fair value, the stock should be trading at $103.9. This suggests that Axonics might be significantly undervalued.
Understanding GF Value
The GF Value is a proprietary measure that calculates the intrinsic value of a stock. It relies on three key factors: historical multiples that the stock has traded at, a GuruFocus adjustment factor based on the company's past returns and growth, and future estimates of business performance. The GF Value Line on our summary page provides an overview of the fair value that the stock should be trading at.
If the stock price is significantly above the GF Value Line, it is overvalued and its future return is likely to be poor. Conversely, if it is significantly below the GF Value Line, its future return will likely be higher.
Based on this method, Axonics stock shows every sign of being significantly undervalued. Therefore, the long-term return of its stock is likely to be much higher than its business growth.
Link: These companies may deliver higher future returns at reduced risk.
Financial Strength
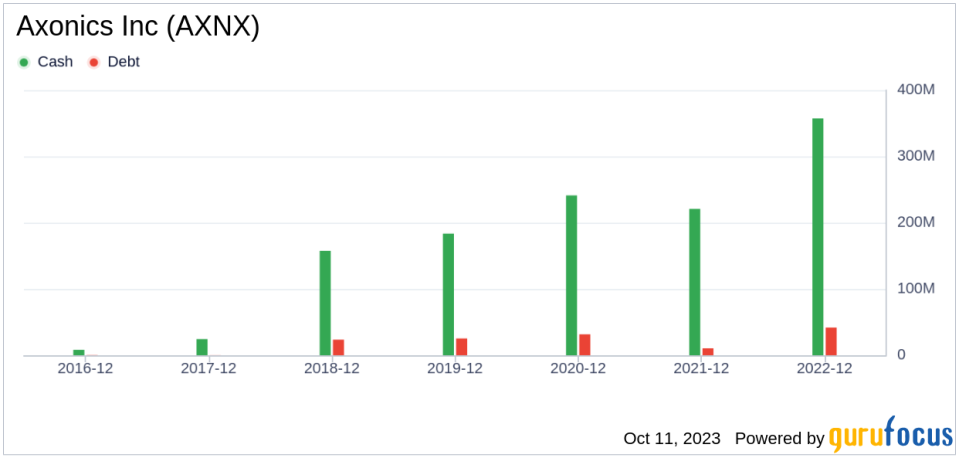
Companies with poor financial strength offer investors a high risk of permanent capital loss. To avoid this, an investor must review a company's financial strength before deciding to purchase shares. Both the cash-to-debt ratio and interest coverage of a company are great ways to understand its financial strength.
Axonics has a cash-to-debt ratio of 111.7, which ranks better than 85.59% of 833 companies in the Medical Devices & Instruments industry. The overall financial strength of Axonics is 8 out of 10, indicating strong financial health.
Profitability and Growth
Investing in profitable companies carries less risk, especially in companies that have demonstrated consistent profitability over the long term. Typically, a company with high profit margins offers better performance potential than a company with low profit margins. Axonics has been profitable 0 years over the past 10 years. During the past 12 months, the company had revenues of $319.90 million and a Loss Per Share of $0.67. Its operating margin of -5.71% is worse than 55.54% of 830 companies in the Medical Devices & Instruments industry. Overall, GuruFocus ranks Axonics's profitability as poor.
Growth is one of the most important factors in the valuation of a company. Long-term stock performance is closely correlated with growth according to GuruFocus research. Companies that grow faster create more value for shareholders, especially if that growth is profitable. The average annual revenue growth of Axonics is 129.7%, which ranks better than 96.84% of 727 companies in the Medical Devices & Instruments industry. The 3-year average EBITDA growth is 27.2%, which ranks better than 73.42% of 730 companies in the Medical Devices & Instruments industry.
ROIC vs WACC
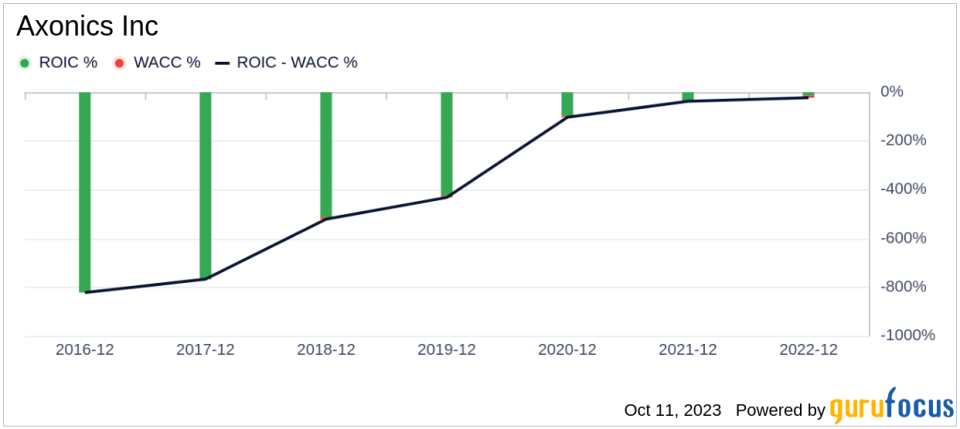
Another way to look at the profitability of a company is to compare its return on invested capital and the weighted cost of capital. Return on invested capital (ROIC) measures how well a company generates cash flow relative to the capital it has invested in its business. The weighted average cost of capital (WACC) is the rate that a company is expected to pay on average to all its security holders to finance its assets. We want to have the return on invested capital higher than the weighted cost of capital. For the past 12 months, Axonics's return on invested capital is -6.01, and its cost of capital is 8.14.
Conclusion
Overall, Axonics (NASDAQ:AXNX) stock shows every sign of being significantly undervalued. The company's financial condition is strong, but its profitability is poor. Its growth ranks better than 73.42% of 730 companies in the Medical Devices & Instruments industry. To learn more about Axonics stock, you can check out its 30-Year Financials here.
To find out the high-quality companies that may deliver above-average returns, please check out GuruFocus High Quality Low Capex Screener.
This article, generated by GuruFocus, is designed to provide general insights and is not tailored financial advice. Our commentary is rooted in historical data and analyst projections, utilizing an impartial methodology, and is not intended to serve as specific investment guidance. It does not formulate a recommendation to purchase or divest any stock and does not consider individual investment objectives or financial circumstances. Our objective is to deliver long-term, fundamental data-driven analysis. Be aware that our analysis might not incorporate the most recent, price-sensitive company announcements or qualitative information. GuruFocus holds no position in the stocks mentioned herein.
This article first appeared on GuruFocus.
