Unveiling B2Gold (BTG)'s Value: Is It Really Priced Right? A Comprehensive Guide
With a daily gain of 3.78%, a 3-month loss of -9.24%, and an Earnings Per Share (EPS) of 0.27, B2Gold Corp (BTG) is a stock that has been under our radar. The question that arises now is, is this stock modestly undervalued? This article aims to provide a comprehensive valuation analysis of B2Gold. Read on to discover more about this intriguing stock.
Company Introduction
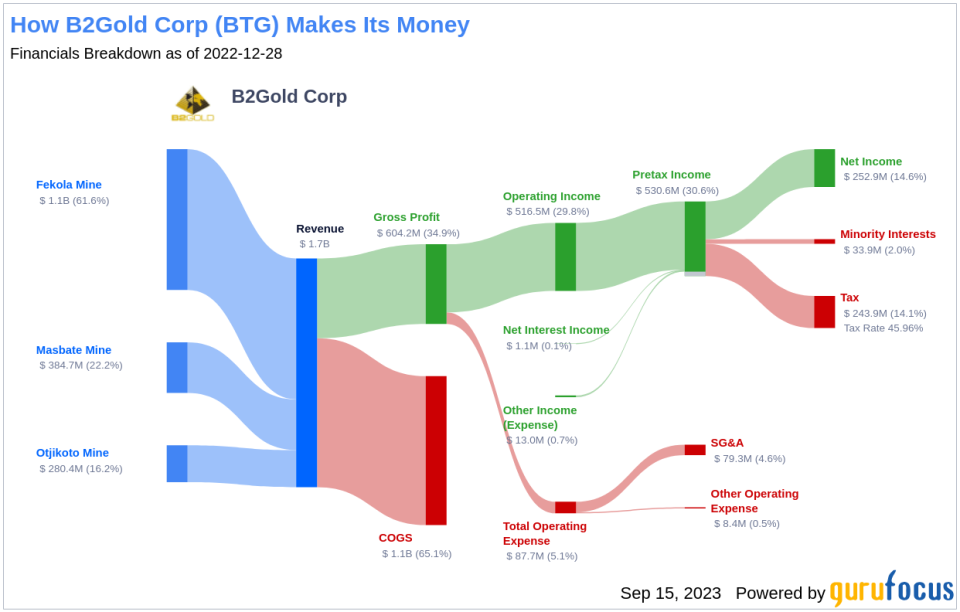
B2Gold Corp is a global, low-cost, senior gold mining company with operating open-pit gold mines in Mali, Namibia, and the Philippines. It also has numerous exploration projects across four continents. The company focuses on acquiring and developing interests in mineral properties, primarily gold deposits. The gold is sold into a global market, ensuring no dependence on a particular purchaser. The company's revenue is generated mainly from the Fekola mine segment in Mali.
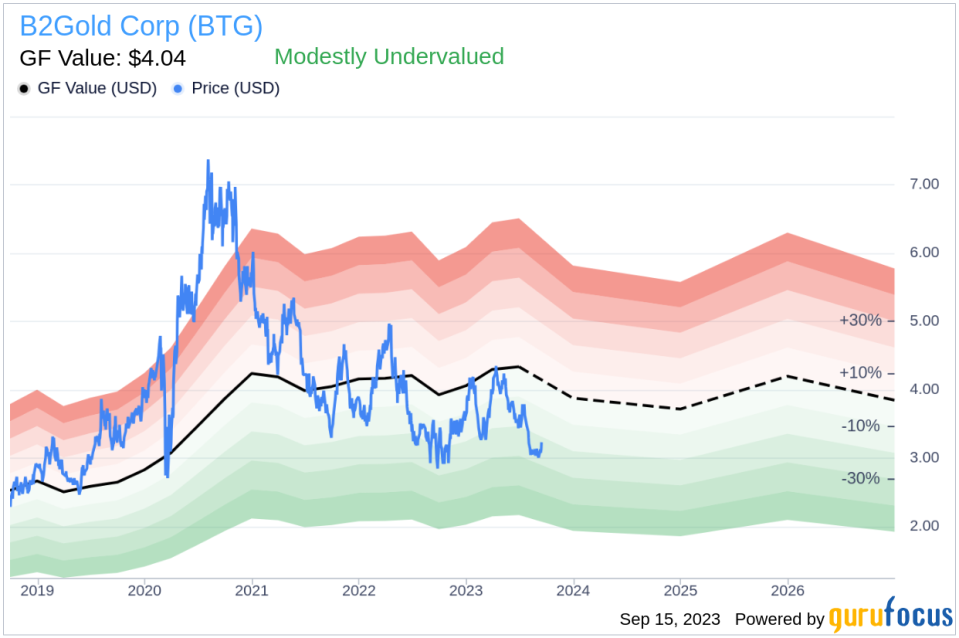
B2Gold's stock price currently stands at $3.25 per share, with a market cap of $4.20 billion. However, the GF Value, an estimation of the fair value, is $4.04. This discrepancy paves the way for a more profound exploration of the company's value.
Understanding GF Value
The GF Value is a proprietary measure that represents the current intrinsic value of a stock. It's calculated based on historical trading multiples, a GuruFocus adjustment factor based on the company's past performance and growth, and future business performance estimates. The GF Value Line provides an overview of the stock's ideal fair trading value.
According to GuruFocus Value calculation, B2Gold (BTG) is estimated to be modestly undervalued. If the stock price is significantly above the GF Value Line, it is overvalued, and its future return is likely to be poor. Conversely, if it is significantly below the GF Value Line, its future return will likely be higher.
Given B2Gold's current status of being relatively undervalued, the long-term return of its stock is likely to be higher than its business growth.
Link: These companies may deliver higher future returns at reduced risk.
Financial Strength
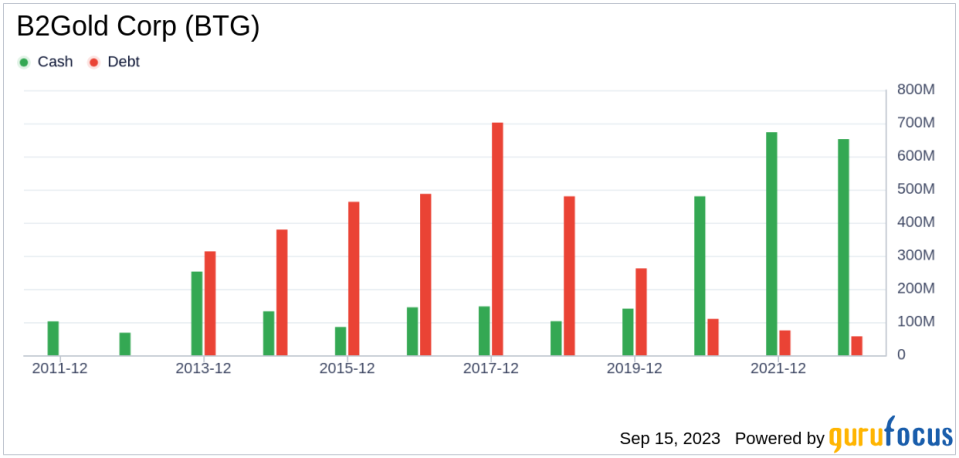
Investing in companies with low financial strength could result in permanent capital loss. Therefore, it's crucial to review a company's financial strength before deciding to buy shares. B2Gold has a cash-to-debt ratio of 9.11, which ranks worse than 59.84% of 2597 companies in the Metals & Mining industry. Despite this, GuruFocus ranks B2Gold's financial strength as 9 out of 10, suggesting a strong balance sheet.
Profitability and Growth
Investing in profitable companies, especially those with consistent profitability over the long term, poses less risk. B2Gold has been profitable 8 out of the past 10 years. Over the past twelve months, the company had a revenue of $1.90 billion and an Earnings Per Share (EPS) of $0.27. Its operating margin is 33.45%, which ranks better than 90.68% of 848 companies in the Metals & Mining industry. GuruFocus ranks the profitability of B2Gold at 8 out of 10, indicating strong profitability.
Growth is a crucial factor in the valuation of a company. The faster a company is growing, the more likely it is to be creating value for shareholders. B2Gold's 3-year average annual revenue growth rate is 13.9%, which ranks better than 55.45% of 606 companies in the Metals & Mining industry. However, the 3-year average EBITDA growth rate is 6.2%, which ranks worse than 56.44% of 1857 companies in the Metals & Mining industry.
ROIC vs WACC
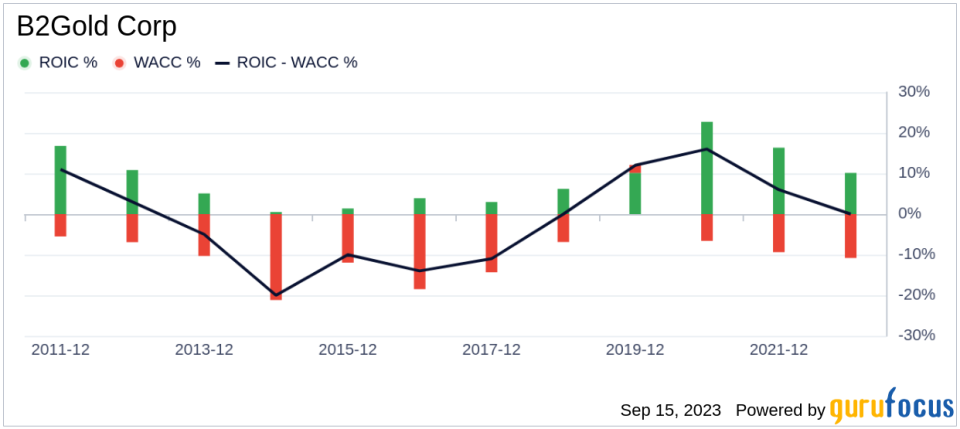
Comparing a company's return on invested capital (ROIC) to the weighted average cost of capital (WACC) can help determine its profitability. ROIC measures how well a company generates cash flow relative to the capital it has invested in its business, while WACC represents the average rate that a company is expected to pay to finance its assets. When the ROIC is higher than the WACC, it implies the company is creating value for shareholders. For the past 12 months, B2Gold's ROIC is 11.96, and its WACC is 6.06.
Conclusion
In conclusion, B2Gold (BTG) stock is estimated to be modestly undervalued. The company's financial condition is strong, and its profitability is robust. However, its growth ranks worse than 56.44% of 1857 companies in the Metals & Mining industry. For more information about B2Gold stock, you can check out its 30-Year Financials here.
To discover high-quality companies that may deliver above-average returns, check out the GuruFocus High Quality Low Capex Screener.
This article first appeared on GuruFocus.
