Unveiling BlackLine (BL)'s Value: Is It Really Priced Right? A Comprehensive Guide
BlackLine Inc (NASDAQ:BL) experienced a daily loss of -5.1% and a 3-month loss of -3.08%. Its Earnings Per Share (EPS) stands at 0.09. These figures raise an important question: Is the stock significantly undervalued? This article presents a detailed valuation analysis of BlackLine to provide a clear answer. Read on to understand the intrinsic worth of this stock.
Company Overview
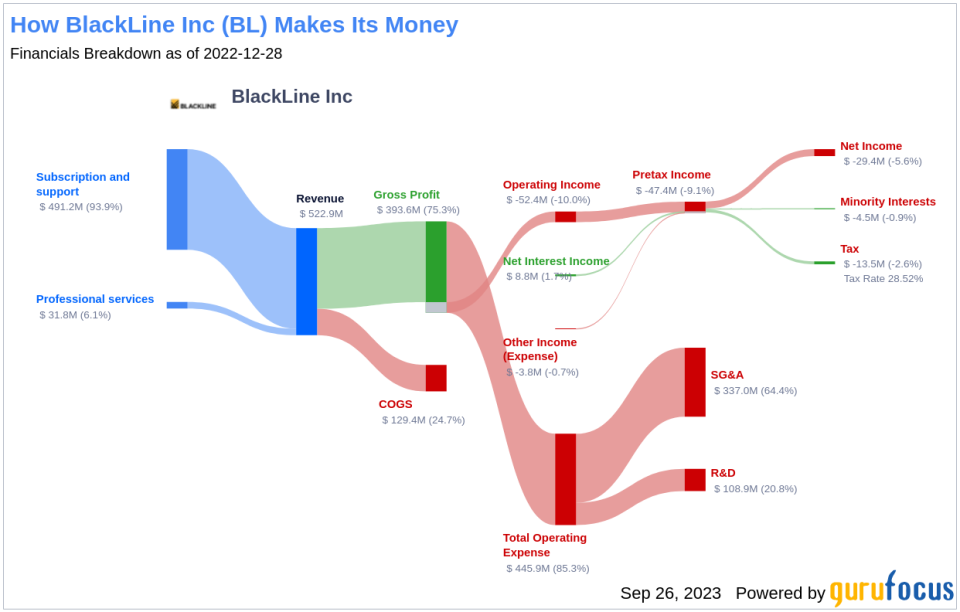
BlackLine Inc is a leading provider of financial accounting close solutions delivered as Software as a Service (SaaS). The company's solutions enable its customers to address various aspects of their financial close process including account reconciliations, variance analysis of account balances, journal entry capabilities, and certain types of data matching capabilities. Most of its revenue is generated in the United States.
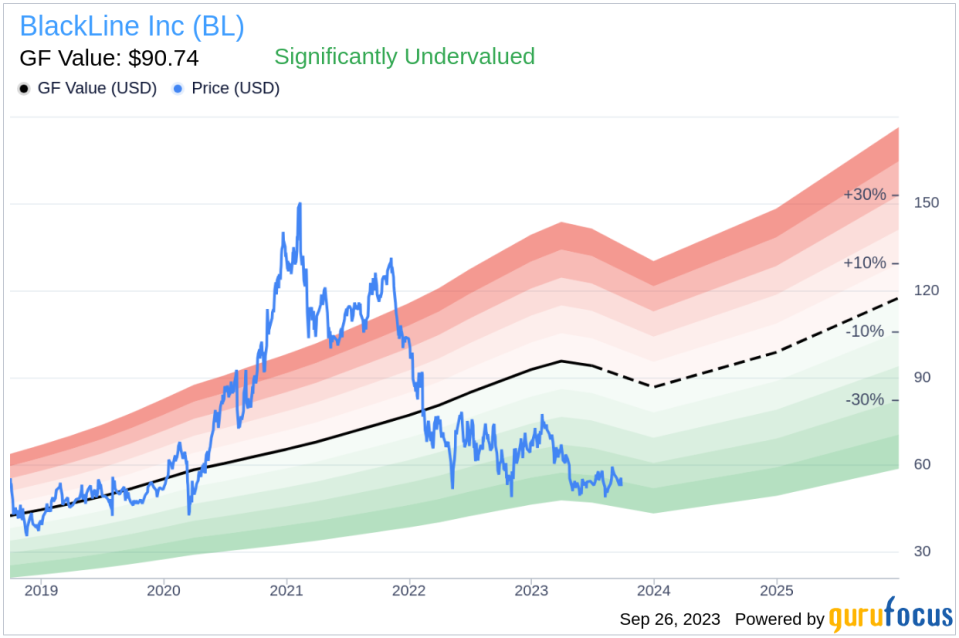
With a current stock price of $52.8 per share and a market cap of $3.20 billion, BlackLine's value compared to its GF Value of $90.74 suggests that the stock might be significantly undervalued. The following analysis will provide a deeper understanding of the company's value.
Understanding GF Value
The GF Value represents the current intrinsic value of a stock derived from our exclusive method. It is calculated based on historical multiples, a GuruFocus adjustment factor based on the company's past returns and growth, and future estimates of the business performance. The GF Value Line on our summary page gives an overview of the fair value that the stock should be traded at.
BlackLine's stock appears to be significantly undervalued based on GuruFocus' valuation method. If the stock's share price is significantly above the GF Value Line, the stock may be overvalued and have poor future returns. On the other hand, if the stock's share price is significantly below the GF Value Line, the stock may be undervalued and have high future returns.
Given that BlackLine is significantly undervalued, the long-term return of its stock is likely to be much higher than its business growth.
Link: These companies may deliever higher future returns at reduced risk.
Financial Strength
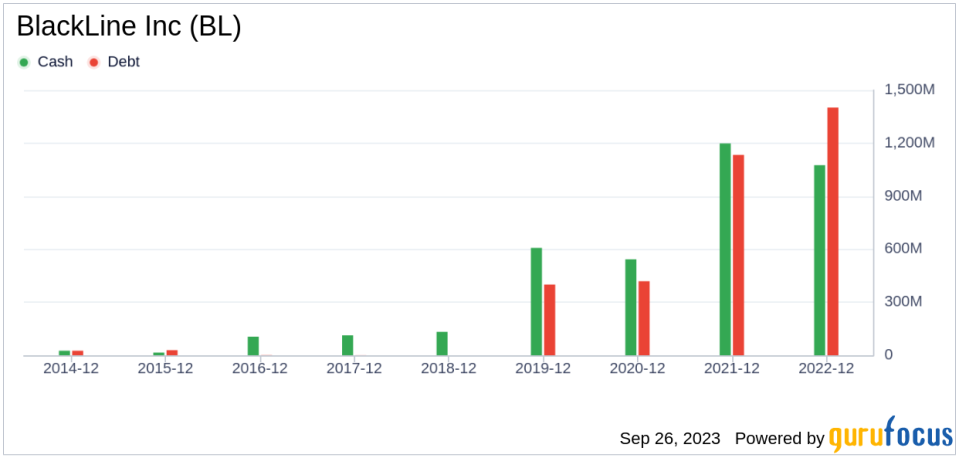
It is always important to check the financial strength of a company before buying its stock. Investing in companies with poor financial strength have a higher risk of permanent loss. Looking at the cash-to-debt ratio and interest coverage is a great way to understand the financial strength of a company. BlackLine has a cash-to-debt ratio of 0.8, which is worse than 68.77% of 2751 companies in the Software industry. The overall financial strength of BlackLine is 4 out of 10, which indicates that the financial strength of BlackLine is poor.
Profitability and Growth
Investing in profitable companies, especially those that have demonstrated consistent profitability over the long term, poses less risk. BlackLine has been profitable 0 over the past 10 years. Over the past twelve months, the company had a revenue of $557.80 million and Earnings Per Share (EPS) of $0.09. Its operating margin is -1.89%, which ranks worse than 59.25% of 2785 companies in the Software industry. Overall, GuruFocus ranks the profitability of BlackLine at 4 out of 10, which indicates poor profitability.
Growth is probably the most important factor in the valuation of a company. The faster a company is growing, the more likely it is to be creating value for shareholders, especially if the growth is profitable. The 3-year average annual revenue growth rate of BlackLine is18.9%, which ranks better than 72.23% of 2413 companies in the Software industry. The 3-year average EBITDA growth rate is 0%, which ranks worse than 0% of 2006 companies in the Software industry.
ROIC vs WACC
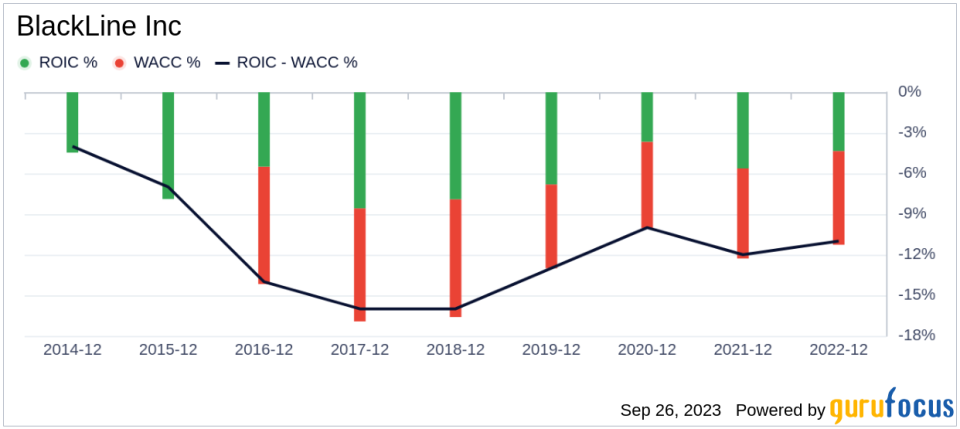
One can also evaluate a company's profitability by comparing its return on invested capital (ROIC) to its weighted average cost of capital (WACC). Return on invested capital (ROIC) measures how well a company generates cash flow relative to the capital it has invested in its business. The weighted average cost of capital (WACC) is the rate that a company is expected to pay on average to all its security holders to finance its assets. If the return on invested capital exceeds the weighted average cost of capital, the company is likely creating value for its shareholders. During the past 12 months, BlackLine's ROIC is -0.97 while its WACC came in at 6.63.
Conclusion
In short, the stock of BlackLine (NASDAQ:BL) appears to be significantly undervalued. The company's financial condition is poor and its profitability is poor. Its growth ranks worse than 0% of 2006 companies in the Software industry. To learn more about BlackLine stock, you can check out its 30-Year Financials here.
To find out the high quality companies that may deliever above average returns, please check out GuruFocus High Quality Low Capex Screener.
This article first appeared on GuruFocus.
