Unveiling Camtek (CAMT)'s Value: Is It Really Priced Right? A Comprehensive Guide
Camtek Ltd (NASDAQ:CAMT) experienced a 3.5% loss on September 14, 2023, although it boasts a significant 70.74% gain over the past three months. With an Earnings Per Share (EPS) of 1.62, the question arises: is the stock significantly overvalued? This article aims to answer this question through a thorough valuation analysis. Keep reading to gain valuable insights into Camtek's intrinsic value.
Company Introduction
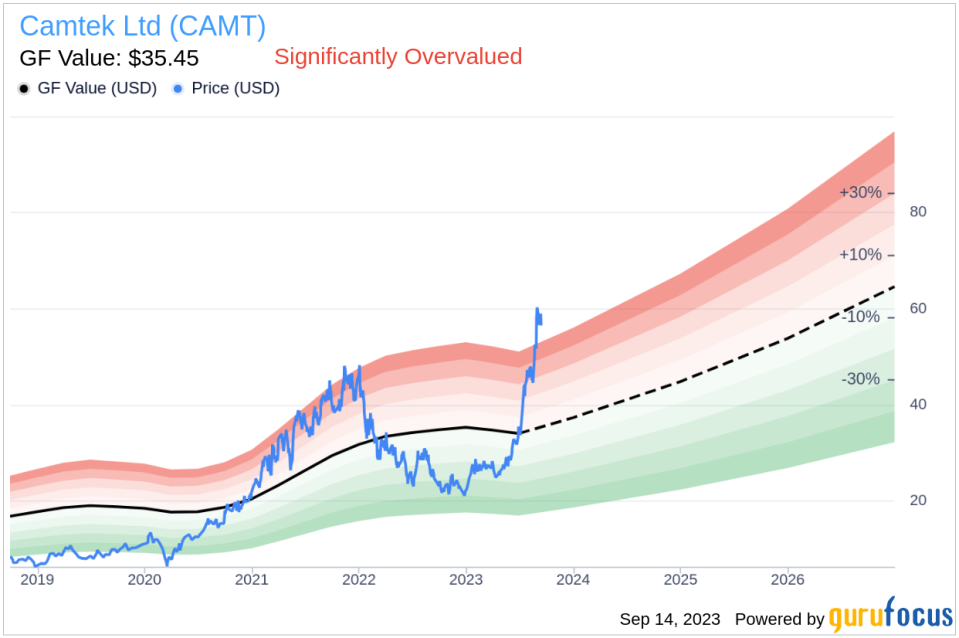
Camtek Ltd (NASDAQ:CAMT) is a leading manufacturer of metrology and inspection equipment, with a strong presence in advanced packaging, memory, CMOS image sensors, MEMS, RF, and other sectors. The company has a significant footprint in the Asia Pacific, the United States, and Europe. With a current stock price of $56.55 and a fair value (GF Value) of $35.45, it's crucial to analyze whether Camtek is overvalued or undervalued.
Understanding the GF Value
The GF Value is a unique measure of a stock's intrinsic value, based on historical trading multiples, a GuruFocus adjustment factor, and future business performance estimates. If a stock's price is significantly above the GF Value Line, it's deemed overvalued, and its future return is likely to be poor. Conversely, if it's significantly below the GF Value Line, its future return will likely be higher.
Camtek's stock shows signs of being significantly overvalued, according to GuruFocus Value calculation. With a market cap of $2.50 billion, the stock's long-term return is likely to be much lower than its future business growth.
Examining Camtek's Financial Strength
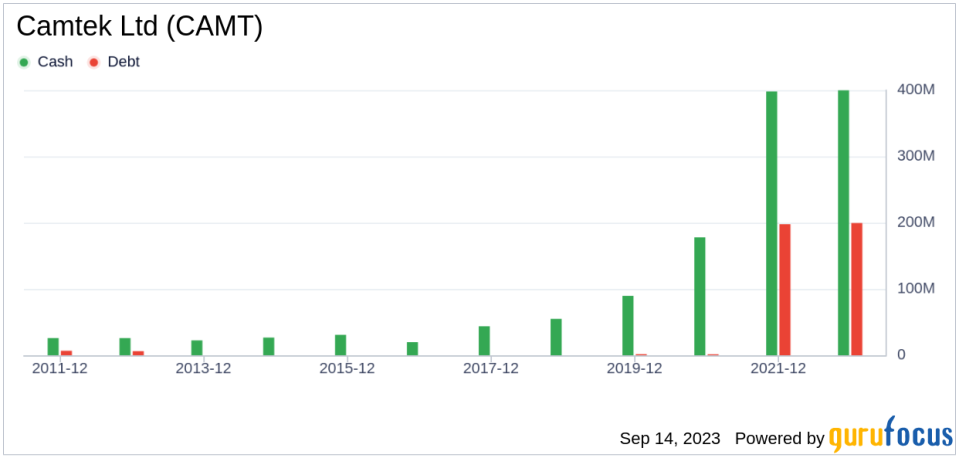
Investing in companies with poor financial strength carries a higher risk of permanent capital loss. Therefore, it's crucial to review a company's financial strength before deciding to buy its stock. Camtek's cash-to-debt ratio of 2.2 is better than 51.44% of 900 companies in the Semiconductors industry, indicating strong financial strength.
Profitability and Growth
Companies with consistent profitability over the long term offer less risk for investors. Camtek has been profitable 9 over the past 10 years, with an operating margin of 22.63%, ranking better than 85.7% of 944 companies in the Semiconductors industry.
Growth is a crucial factor in a company's valuation. Camtek's 3-year average annual revenue growth rate is 24%, which ranks better than 75.49% of 869 companies in the Semiconductors industry. The 3-year average EBITDA growth rate is 45.9%, ranking better than 77.59% of 772 companies in the industry.
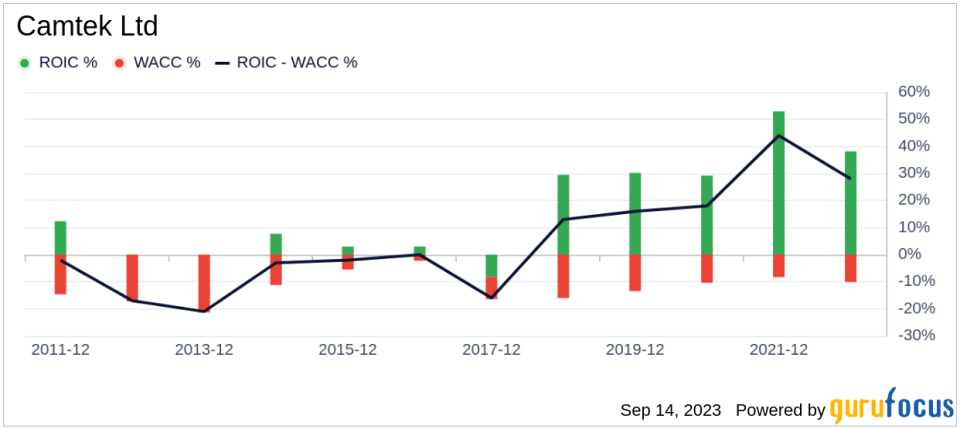
ROIC vs WACC
Comparing a company's return on invested capital (ROIC) to the weighted average cost of capital (WACC) can provide insights into its profitability. Camtek's ROIC of 27.7 is significantly higher than its WACC of 10.38, implying that the company is creating value for shareholders.
Conclusion
In conclusion, Camtek's stock appears to be significantly overvalued. Despite its strong financial condition and profitability, the stock's long-term return is likely to be much lower than its future business growth. To learn more about Camtek stock, you can check out its 30-Year Financials here.
To find high-quality companies that may deliver above-average returns, check out the GuruFocus High Quality Low Capex Screener.
This article first appeared on GuruFocus.
