Unveiling Cenovus Energy (CVE)'s Value: Is It Really Priced Right? A Comprehensive Guide
Today, we turn our focus to Cenovus Energy Inc (NYSE:CVE), a player in the oil and gas industry. With a daily gain of 4.61% and a 3-month gain of 17.51%, the company's stock performance appears robust. Its Earnings Per Share (EPS) stands at 1.46. However, the question remains: is the stock modestly overvalued? In this article, we delve into a comprehensive analysis of Cenovus Energy's valuation, using the proprietary GF Value as a guide. We invite you to journey with us as we explore the intrinsic value of this company.
Company Introduction
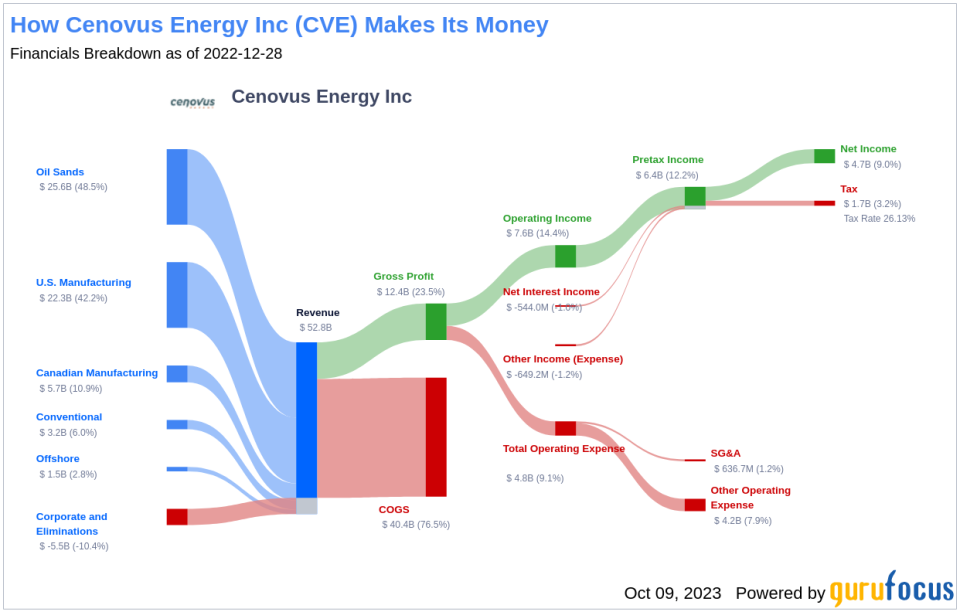
Cenovus Energy Inc (NYSE:CVE) is an integrated oil company primarily engaged in the development of oil sands assets. The company's operations span conventional crude oil, natural gas liquids, and natural gas production in Alberta, Canada, and refining operations in the U.S. In 2022, Cenovus Energy averaged 786 thousand barrels of oil equivalent per day in upstream production. The company's downstream operations include upgrading and refining operations in Canada and the U.S., and commercial fuel operations across Canada.
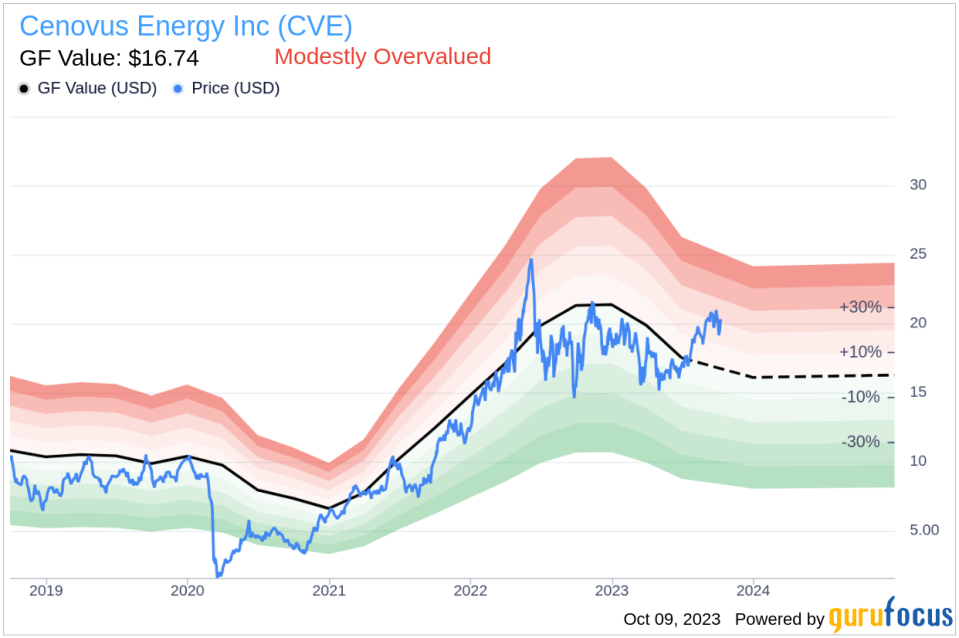
At a current share price of $20.3, the stock's GF Value stands at $16.74, indicating a modest overvaluation. To understand this better, let's break down the GF Value.
Understanding GF Value
The GF Value is a unique measure of a stock's intrinsic value, calculated based on historical multiples, a GuruFocus adjustment factor, and future business performance estimates. The GF Value Line provides a visual representation of the stock's fair value. If the stock price significantly deviates from the GF Value Line, it may be overvalued or undervalued, affecting future returns.
For Cenovus Energy (NYSE:CVE), the GF Value suggests modest overvaluation. This is based on historical multiples, the company's past business growth, and analyst estimates of future business performance. Thus, the long-term return of Cenovus Energy's stock is likely to be lower than its business growth.
Link: These companies may deliver higher future returns at reduced risk.
Financial Strength
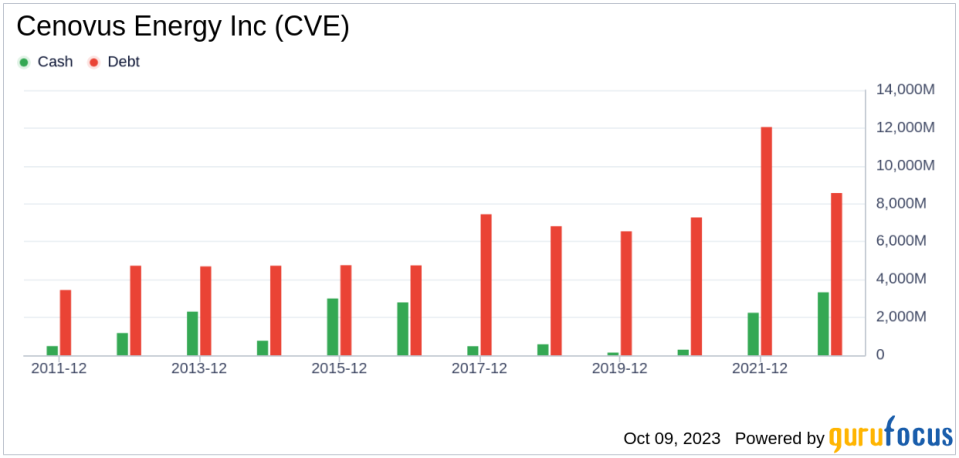
Investing in companies with poor financial strength can lead to a higher risk of permanent capital loss. Therefore, it is essential to review a company's financial strength before investing. A look at Cenovus Energy's cash-to-debt ratio and interest coverage provides a good starting point. With a cash-to-debt ratio of 0.19, Cenovus Energy ranks lower than 69.68% of 1029 companies in the Oil & Gas industry. However, its overall financial strength is fair, with a GuruFocus rank of 6 out of 10.
Profitability and Growth
Investing in profitable companies is typically less risky, especially those with consistent profitability over the long term. Cenovus Energy has been profitable 7 over the past 10 years, with an operating margin of 8.69%, ranking better than 50.2% of 982 companies in the Oil & Gas industry. The company's profitability is ranked 6 out of 10, indicating fair profitability.
Growth is a crucial factor in a company's valuation. According to GuruFocus research, long-term stock performance is closely correlated with growth. Cenovus Energy's average annual revenue growth is 26.5%, ranking better than 79.72% of 858 companies in the Oil & Gas industry. The 3-year average EBITDA growth is 26.7%, which ranks better than 63.87% of 822 companies in the Oil & Gas industry.
ROIC vs WACC
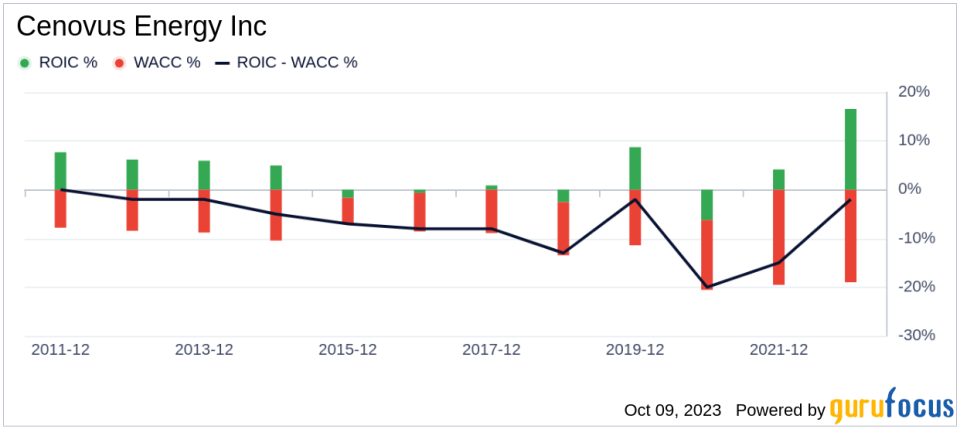
Another way to determine a company's profitability is to compare its return on invested capital (ROIC) to the weighted average cost of capital (WACC). ROIC measures how well a company generates cash flow relative to the capital it has invested in its business. WACC is the rate that a company is expected to pay on average to all its security holders to finance its assets. When ROIC is higher than WACC, it implies the company is creating value for shareholders. For the past 12 months, Cenovus Energy's return on invested capital is 9.08, and its cost of capital is 12.32.
Conclusion
In conclusion, the stock of Cenovus Energy (NYSE:CVE) shows every sign of being modestly overvalued. The company's financial condition is fair, and its profitability is fair. Its growth ranks better than 63.87% of 822 companies in the Oil & Gas industry. To learn more about Cenovus Energy stock, you can check out its 30-Year Financials here.
To find out the high-quality companies that may deliver above-average returns, please check out GuruFocus High Quality Low Capex Screener.
This article, generated by GuruFocus, is designed to provide general insights and is not tailored financial advice. Our commentary is rooted in historical data and analyst projections, utilizing an impartial methodology, and is not intended to serve as specific investment guidance. It does not formulate a recommendation to purchase or divest any stock and does not consider individual investment objectives or financial circumstances. Our objective is to deliver long-term, fundamental data-driven analysis. Be aware that our analysis might not incorporate the most recent, price-sensitive company announcements or qualitative information. GuruFocus holds no position in the stocks mentioned herein.
This article first appeared on GuruFocus.
