Unveiling CF Industries Holdings (CF)'s Value: Is It Really Priced Right? A Comprehensive Guide
CF Industries Holdings Inc (NYSE:CF) recorded a daily gain of 4% and a three-month gain of 17.33%, with an Earnings Per Share (EPS) (EPS) of 12.08. The question that arises is whether the stock is fairly valued. This article will delve into the valuation analysis of CF Industries Holdings Inc, providing insights for potential investors.
Introduction to CF Industries Holdings
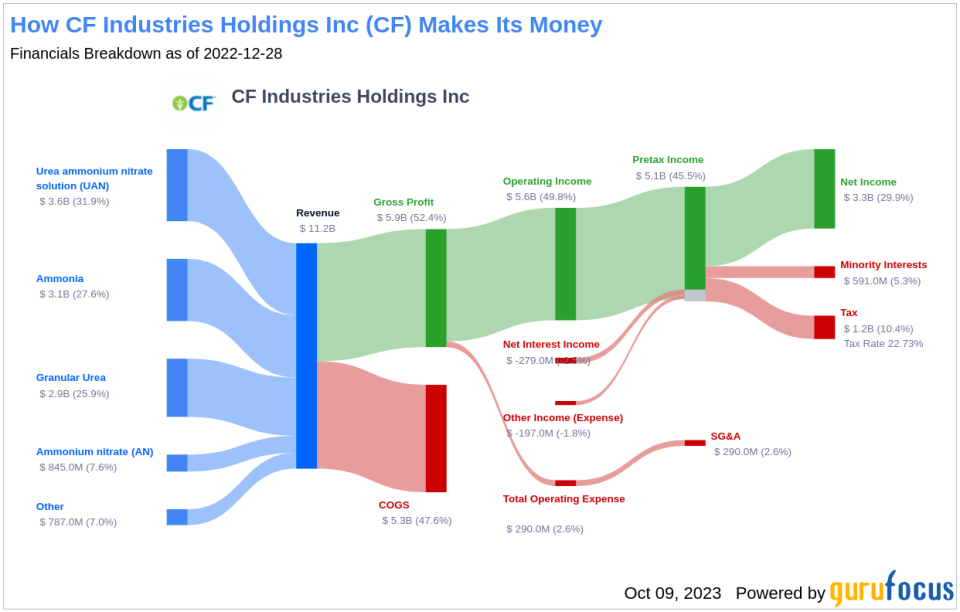
CF Industries Holdings is a leading producer and distributor of nitrogen fertilizers. The company operates seven nitrogen facilities in North America and holds joint venture interests in further production capacity in the United Kingdom and Trinidad and Tobago. Using low-cost U.S. natural gas as its feedstock, CF Industries Holdings is one of the lowest-cost nitrogen producers globally. The company is also investing in carbon-free blue and green ammonia, which can be used as an alternative fuel to hydrogen or as a means to transport hydrogen.
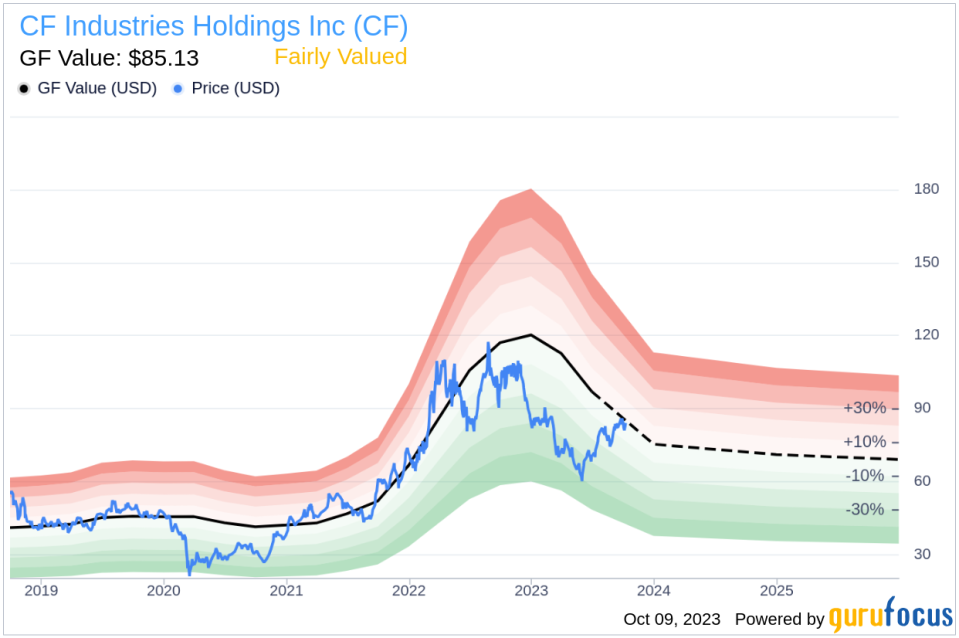
As of October 09, 2023, the company's stock price stands at $84.15, with a market cap of $16.20 billion. The GF Value, an estimation of the stock's fair value, is $85.13, indicating that the stock is fairly valued.
Understanding the GF Value
The GF Value represents the current intrinsic value of a stock derived from GuruFocus's proprietary method. This value is based on historical multiples (PE Ratio, PS Ratio, PB Ratio, and Price-to-Free-Cash-Flow) that the stock has traded at, GuruFocus's adjustment factor based on the company's past returns and growth, and future estimates of the business performance.
The stock of CF Industries Holdings shows every sign of being fairly valued based on GuruFocus' valuation method. If the stock's share price is significantly above the GF Value Line, the stock may be overvalued and have poor future returns. Conversely, if the stock's share price is significantly below the GF Value Line, the stock may be undervalued and have high future returns.
Given that CF Industries Holdings is fairly valued, the long-term return of its stock is likely to be close to the rate of its business growth.
Link: These companies may deliver higher future returns at reduced risk.
Financial Strength
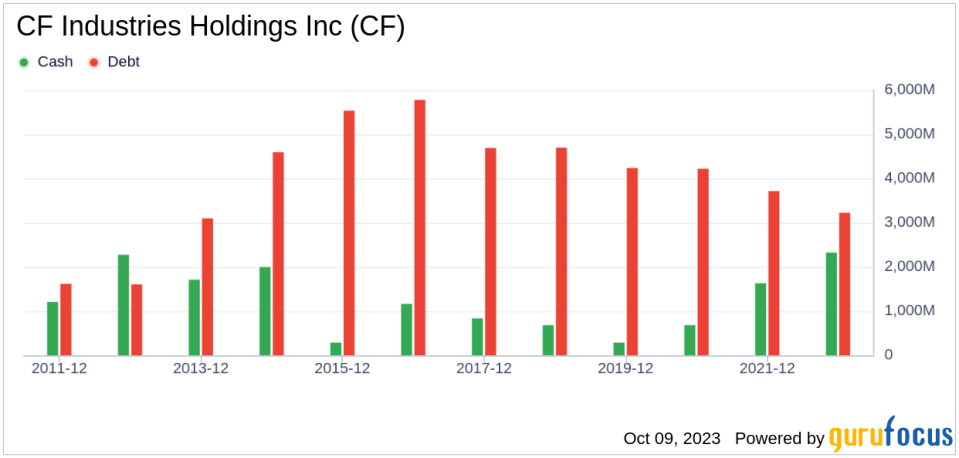
Before investing in a company, it's crucial to check its financial strength. Companies with poor financial strength have a higher risk of permanent loss. CF Industries Holdings has a cash-to-debt ratio of 0.99, which is better than 59.18% of 245 companies in the Agriculture industry. The overall financial strength of CF Industries Holdings is 7 out of 10, indicating fair financial strength.
Profitability and Growth
Investing in profitable companies, especially those with consistent profitability over the long term, is less risky. A company with high profit margins is usually a safer investment than those with low profit margins. CF Industries Holdings has been profitable 9 out of the past 10 years. Over the past twelve months, the company had a revenue of $8.70 billion and an EPS of $12.08. Its operating margin is 41.09%, which ranks better than 95.45% of 242 companies in the Agriculture industry. Overall, the profitability of CF Industries Holdings is ranked 9 out of 10, indicating strong profitability.
Growth is probably the most important factor in the valuation of a company. The faster a company is growing, the more likely it is to be creating value for shareholders, especially if the growth is profitable. The 3-year average annual revenue growth rate of CF Industries Holdings is 38.3%, which ranks better than 85.02% of 227 companies in the Agriculture industry. The 3-year average EBITDA growth rate is 53.9%, which ranks better than 85.32% of 218 companies in the Agriculture industry.
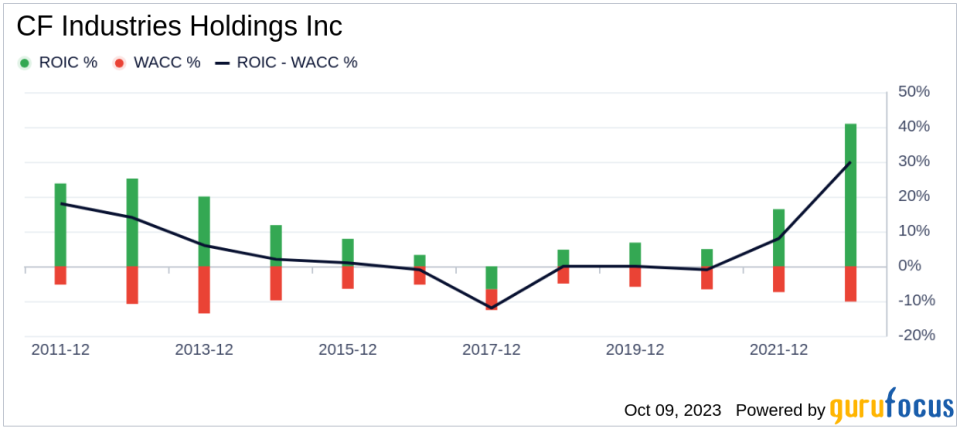
Evaluating a company's profitability by comparing its return on invested capital (ROIC) to its weighted average cost of capital (WACC) is also useful. ROIC measures how well a company generates cash flow relative to the capital it has invested in its business. WACC is the rate that a company is expected to pay on average to all its security holders to finance its assets. If the ROIC exceeds the WACC, the company is likely creating value for its shareholders. During the past 12 months, CF Industries Holdings's ROIC was 28.16 while its WACC came in at 10.62.
Conclusion
In summary, the stock of CF Industries Holdings shows every sign of being fairly valued. The company's financial condition is fair, and its profitability is strong. Its growth ranks better than 85.32% of 218 companies in the Agriculture industry. To learn more about CF Industries Holdings stock, you can check out its 30-Year Financials here.
To find out the high-quality companies that may deliver above-average returns, please check out GuruFocus High Quality Low Capex Screener.
This article, generated by GuruFocus, is designed to provide general insights and is not tailored financial advice. Our commentary is rooted in historical data and analyst projections, utilizing an impartial methodology, and is not intended to serve as specific investment guidance. It does not formulate a recommendation to purchase or divest any stock and does not consider individual investment objectives or financial circumstances. Our objective is to deliver long-term, fundamental data-driven analysis. Be aware that our analysis might not incorporate the most recent, price-sensitive company announcements or qualitative information. GuruFocus holds no position in the stocks mentioned herein.
This article first appeared on GuruFocus.
