Unveiling CF Industries Holdings (CF)'s Value: Is It Really Priced Right? A Comprehensive Guide
CF Industries Holdings Inc (NYSE:CF) has been in the spotlight recently, with a daily gain of 3.62%, a three-month gain of 21.44%, and an impressive Earnings Per Share (EPS) of 12.08. But, is the stock modestly undervalued? We will delve into its valuation analysis to answer this question. Let's explore further.
Company Overview
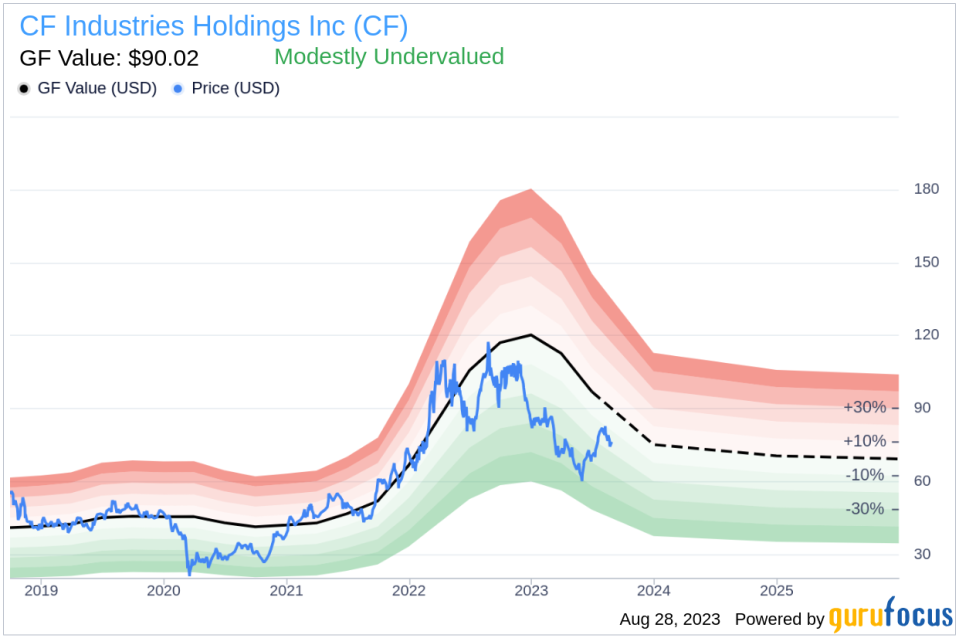
CF Industries Holdings, a leading nitrogen fertilizer producer and distributor, operates seven nitrogen facilities in North America and has joint venture interests in the United Kingdom and Trinidad and Tobago. With low-cost U.S. natural gas as its feedstock, CF Industries Holdings is one of the lowest-cost nitrogen producers globally. The company is also investing in carbon-free blue and green ammonia, an alternative fuel to hydrogen. With a current stock price of $76.25 per share and a market cap of $14.70 billion, the company's GF Value stands at $90.02, indicating that the stock is modestly undervalued.
Understanding the GF Value
The GF Value is a proprietary measure of a stock's intrinsic value. It is calculated based on historical trading multiples, a GuruFocus adjustment factor based on past performance and growth, and future business performance estimates. The GF Value Line on our summary page gives an overview of the fair value that the stock should be traded at. If the stock price is significantly above the GF Value Line, it is overvalued and its future return is likely to be poor. On the other hand, if it is significantly below the GF Value Line, its future return will likely be higher.
CF Industries Holdings' stock appears to be modestly undervalued based on the GuruFocus Value calculation. Because CF Industries Holdings is relatively undervalued, the long-term return of its stock is likely to be higher than its business growth.
Link: These companies may deliever higher future returns at reduced risk.
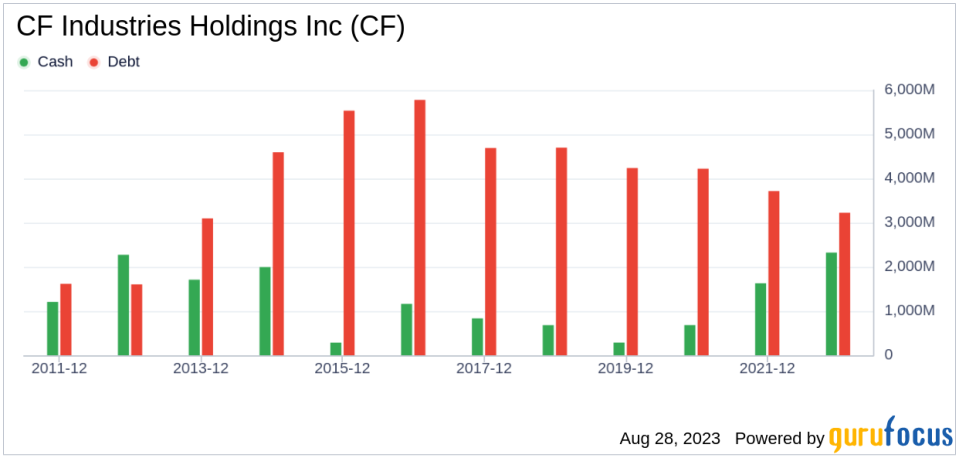
Financial Strength
Investing in companies with strong financial strength reduces the risk of permanent loss. The cash-to-debt ratio and interest coverage are great ways to understand a company's financial strength. CF Industries Holdings has a cash-to-debt ratio of 0.99, which is better than 57.94% of 233 companies in the Agriculture industry. The overall financial strength of CF Industries Holdings is 7 out of 10, indicating fair financial strength.
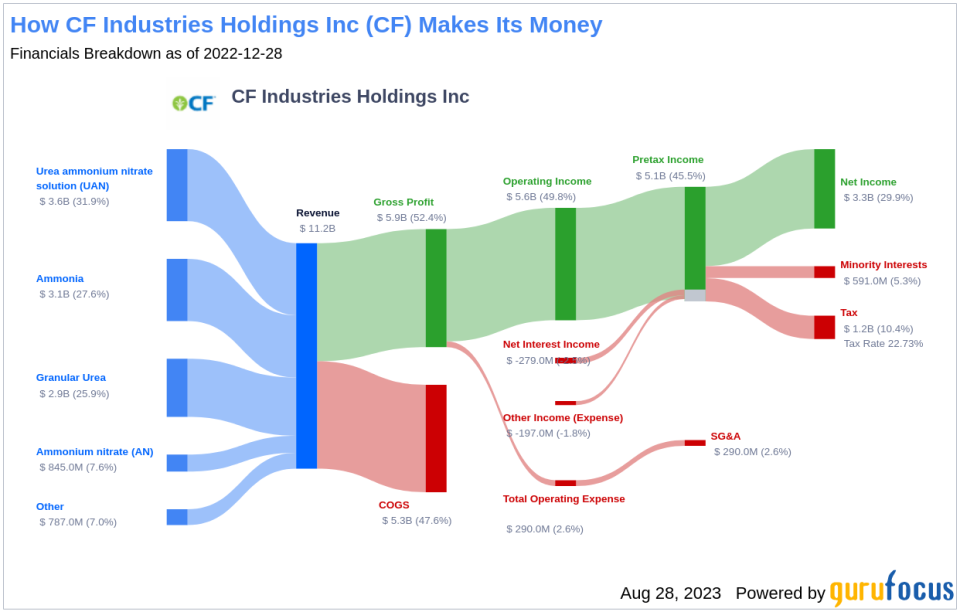
Profitability and Growth
Investing in profitable companies, especially those with consistent profitability and high profit margins, is less risky. CF Industries Holdings has been profitable 9 over the past 10 years. Over the past twelve months, the company had a revenue of $8.70 billion and an Earnings Per Share (EPS) of $12.08. Its operating margin is 41.09%, which ranks better than 95.61% of 228 companies in the Agriculture industry. Overall, GuruFocus ranks the profitability of CF Industries Holdings at 9 out of 10, indicating strong profitability .
Long-term stock performance is closely correlated with growth. Companies that grow faster create more value for shareholders, especially if that growth is profitable. The average annual revenue growth of CF Industries Holdings is 38.3%, which ranks better than 83.41% of 217 companies in the Agriculture industry. The 3-year average EBITDA growth is 53.9%, which ranks better than 83.98% of 206 companies in the Agriculture industry.
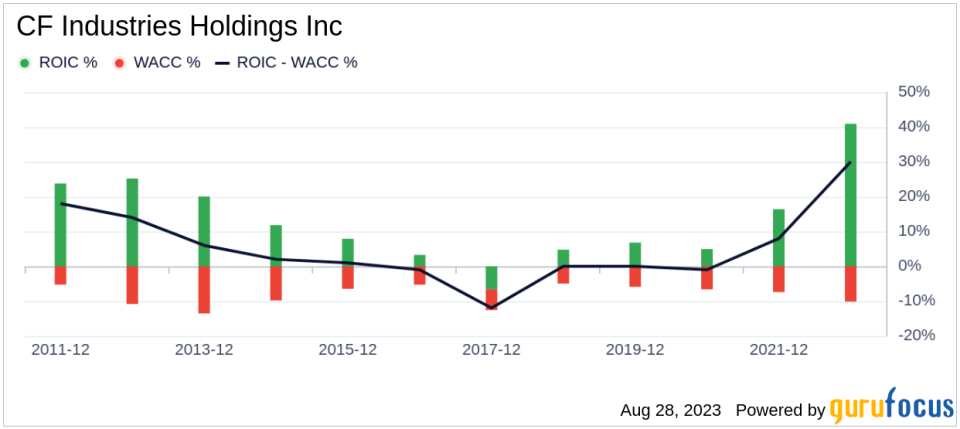
ROIC vs WACC
Comparing a company's return on invested capital (ROIC) to its weighted cost of capital (WACC) can evaluate its profitability. Return on invested capital (ROIC) measures how well a company generates cash flow relative to the capital it has invested in its business. The weighted average cost of capital (WACC) is the rate that a company is expected to pay on average to all its security holders to finance its assets. If the ROIC is higher than the WACC, it indicates that the company is creating value for shareholders. Over the past 12 months, CF Industries Holdings's ROIC was 28.16, while its WACC came in at 9.93.
Conclusion
Overall, CF Industries Holdings (NYSE:CF) stock appears to be modestly undervalued. The company's financial condition is fair, and its profitability is strong. Its growth ranks better than 83.98% of 206 companies in the Agriculture industry. To learn more about CF Industries Holdings stock, you can check out its 30-Year Financials here.
To find out the high quality companies that may deliever above average returns, please check out GuruFocus High Quality Low Capex Screener.
This article first appeared on GuruFocus.
