Unveiling Darling Ingredients (DAR)'s Value: Is It Really Priced Right? A Comprehensive Guide
The stock of Darling Ingredients Inc (NYSE:DAR) has recently seen a daily gain of 6.22%, despite a 3-month loss of 1.74%. The company's Earnings Per Share (EPS) (EPS) stands at 4.82. But is the stock significantly undervalued? This analysis aims to answer this question by examining the intrinsic value of Darling Ingredients Inc. We invite you to read on for a detailed understanding of the company's valuation.
Introduction to Darling Ingredients Inc
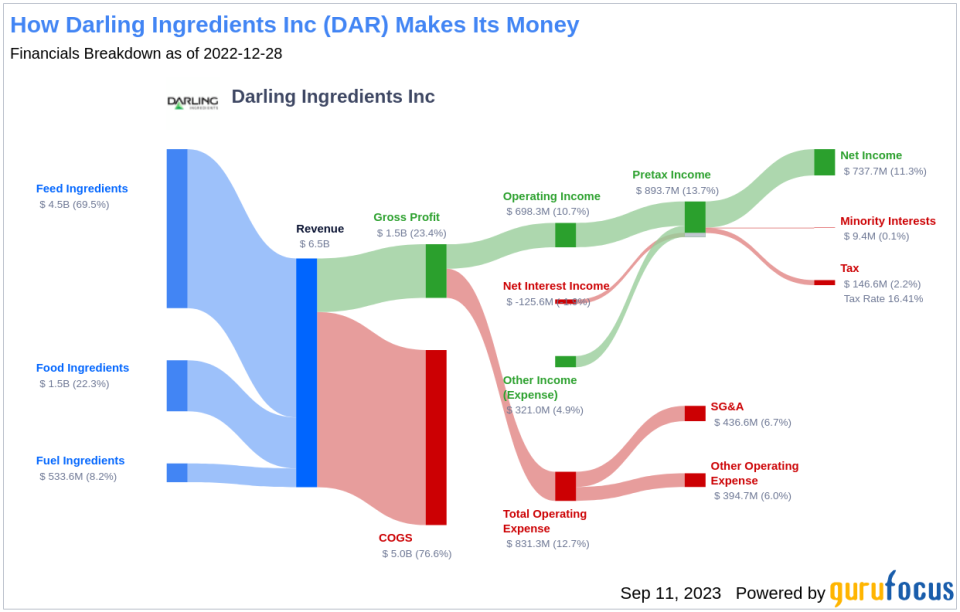
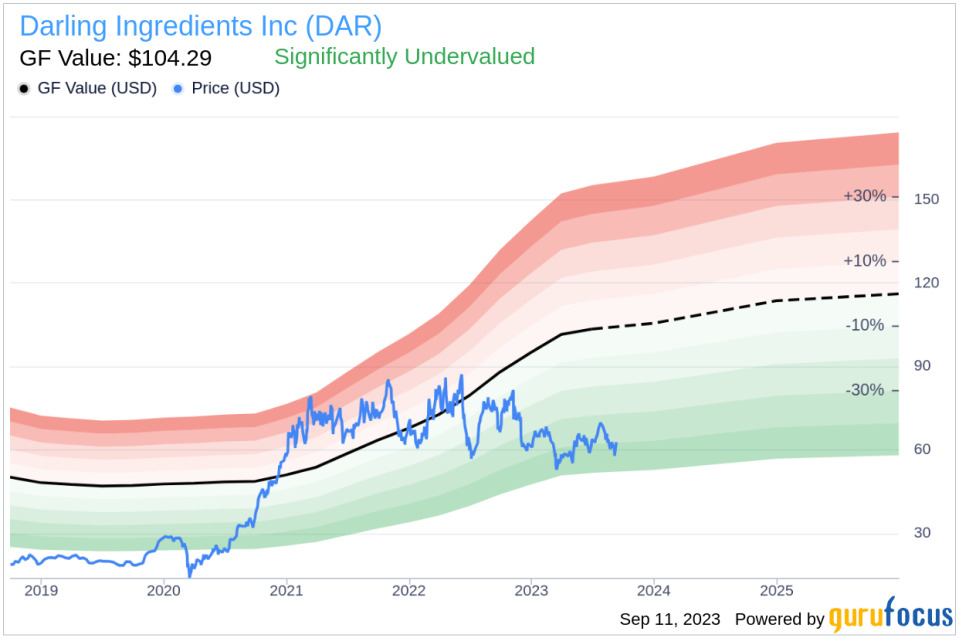
Darling Ingredients Inc develops and manufactures sustainable ingredients for various industries, including pharmaceutical, food, pet food, fuel, and fertilizer. The company's operations involve transforming animal by-product streams into a range of ingredients and recovering used cooking oil and bakery remnants for feed and fuel ingredients. The company's primary business segments include feed ingredients, food ingredients, and fuel ingredients. With the majority of its revenue derived from North America, Darling Ingredients Inc's stock price stands at $62.19, while its estimated fair value (GF Value) is $104.29.
Understanding the GF Value
The GF Value is a proprietary measure that represents the current intrinsic value of a stock. It is derived from historical trading multiples, a GuruFocus adjustment factor based on past performance and growth, and future business performance estimates. The GF Value Line provides an overview of the fair value at which the stock should ideally be traded. If the stock price is significantly above the GF Value Line, it is overvalued, and its future return is likely to be poor. Conversely, if it is significantly below the GF Value Line, its future return will likely be higher.
According to GuruFocus Value calculation, the stock of Darling Ingredients Inc is significantly undervalued. With its current price of $62.19 per share and a market cap of $9.90 billion, the stock is estimated to be significantly undervalued. As a result, the long-term return of its stock is likely to be much higher than its business growth.
Link: These companies may deliever higher future returns at reduced risk.
Financial Strength of Darling Ingredients
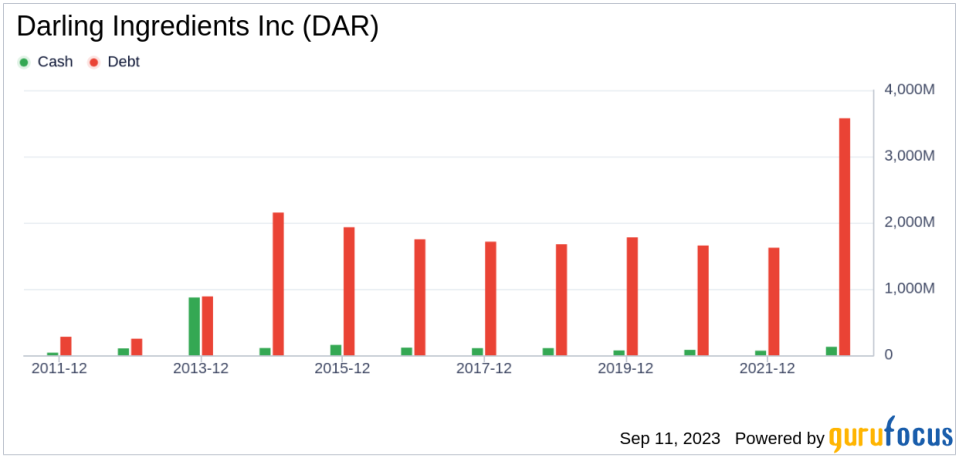
Companies with poor financial strength pose a high risk of permanent capital loss to investors. To avoid this, it's essential to review a company's financial strength before deciding to purchase shares. Factors such as the cash-to-debt ratio and interest coverage of a company are great ways to understand its financial strength. Darling Ingredients has a cash-to-debt ratio of 0.02, which ranks worse than 93.64% of 1793 companies in the Consumer Packaged Goods industry. The overall financial strength of Darling Ingredients is 5 out of 10, indicating that its financial strength is fair.
Profitability and Growth of Darling Ingredients
Companies that have been consistently profitable over the long term offer less risk for investors. Darling Ingredients has been profitable 10 over the past 10 years. Over the past twelve months, the company had a revenue of $7.10 billion and Earnings Per Share (EPS) of $4.82. Its operating margin is 8.89%, which ranks better than 69.34% of 1810 companies in the Consumer Packaged Goods industry. Overall, the profitability of Darling Ingredients is ranked 7 out of 10, indicating fair profitability.
Growth is a crucial factor in the valuation of a company. The 3-year average annual revenue growth rate of Darling Ingredients is 25.8%, which ranks better than 87.81% of 1714 companies in the Consumer Packaged Goods industry. The 3-year average EBITDA growth rate is 22.7%, which ranks better than 73.39% of 1518 companies in the same industry.
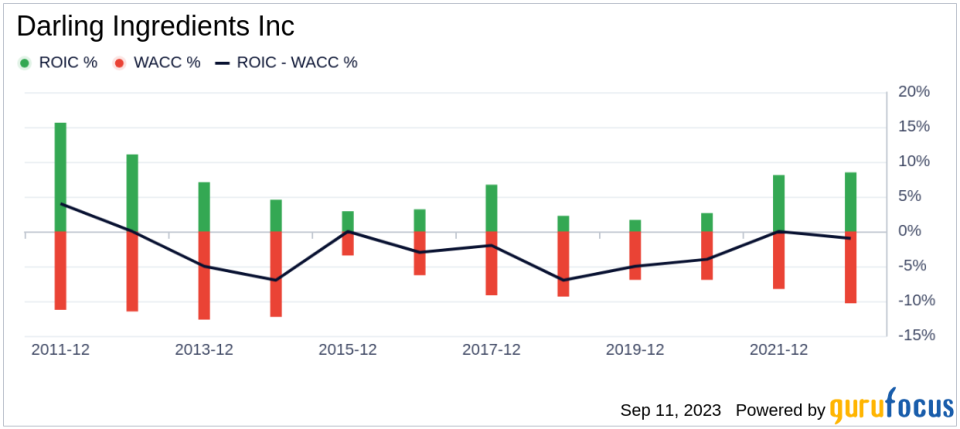
Another way to determine a company's profitability is to compare its return on invested capital (ROIC) to the weighted average cost of capital (WACC). Return on invested capital (ROIC) measures how well a company generates cash flow relative to the capital it has invested in its business. The weighted average cost of capital (WACC) is the rate that a company is expected to pay on average to all its security holders to finance its assets. When the ROIC is higher than the WACC, it implies the company is creating value for shareholders. For the past 12 months, Darling Ingredients's return on invested capital is 6.15, and its cost of capital is 9.59.
Conclusion
In summary, the stock of Darling Ingredients (NYSE:DAR) is estimated to be significantly undervalued. The company's financial condition is fair, and its profitability is fair. Its growth ranks better than 73.39% of 1518 companies in the Consumer Packaged Goods industry. To learn more about Darling Ingredients stock, you can check out its 30-Year Financials here.
To find out the high quality companies that may deliver above-average returns, please check out GuruFocus High Quality Low Capex Screener.
This article first appeared on GuruFocus.
