Unveiling the Dividend Performance of Farmers & Merchants Bancorp Inc (FMAO)
A Comprehensive Analysis of the Company's Dividend History, Yield, Growth, and Sustainability
Farmers & Merchants Bancorp Inc (NASDAQ:FMAO) recently announced a dividend of $0.21 per share, payable on 2023-10-20, with the ex-dividend date set for 2023-10-05. As investors look forward to this upcoming payment, the spotlight also shines on the company's dividend history, yield, and growth rates. Using the data from GuruFocus, let's deep dive into Farmers & Merchants Bancorp Inc's dividend performance and assess its sustainability.
Understanding Farmers & Merchants Bancorp Inc
Warning! GuruFocus has detected 6 Warning Signs with FMAO. Click here to check it out.
This Powerful Chart Made Peter Lynch 29% A Year For 13 Years
How to calculate the intrinsic value of a stock?
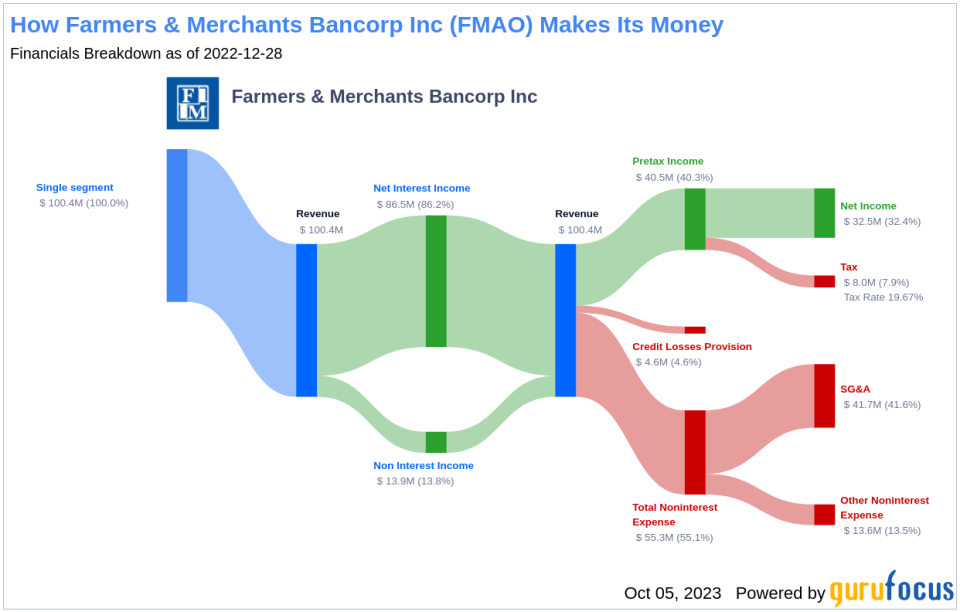
Farmers & Merchants Bancorp Inc is a holding company for Farmers & Merchants Bank of Central California. It engages in general commercial banking business. Its activities include commercial, agricultural and residential mortgages as well as consumer and credit card lending activities. The interest received on lending to the commercial and retail market forms the basis of the bank's primary revenue.
Examining Farmers & Merchants Bancorp Inc's Dividend History
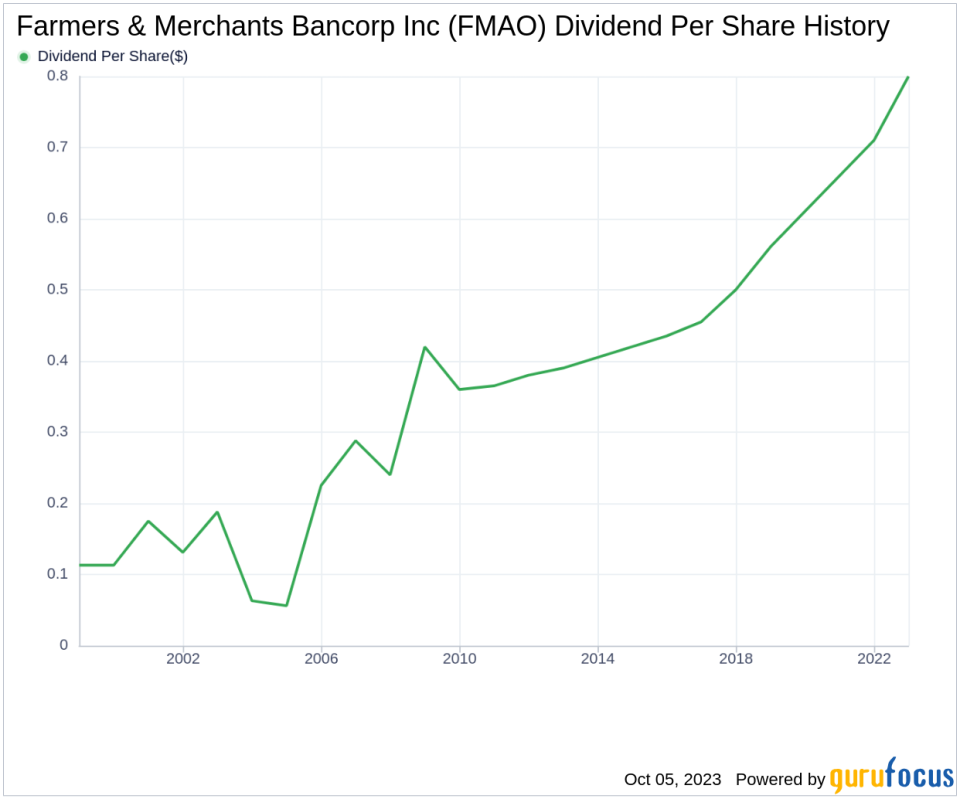
Farmers & Merchants Bancorp Inc has maintained a consistent dividend payment record since 1997. Dividends are currently distributed on a quarterly basis. Farmers & Merchants Bancorp Inc has increased its dividend each year since 2009. The stock is thus listed as a dividend achiever, an honor that is given to companies that have increased their dividend each year for at least the past 14 years.
Dissecting Farmers & Merchants Bancorp Inc's Dividend Yield and Growth
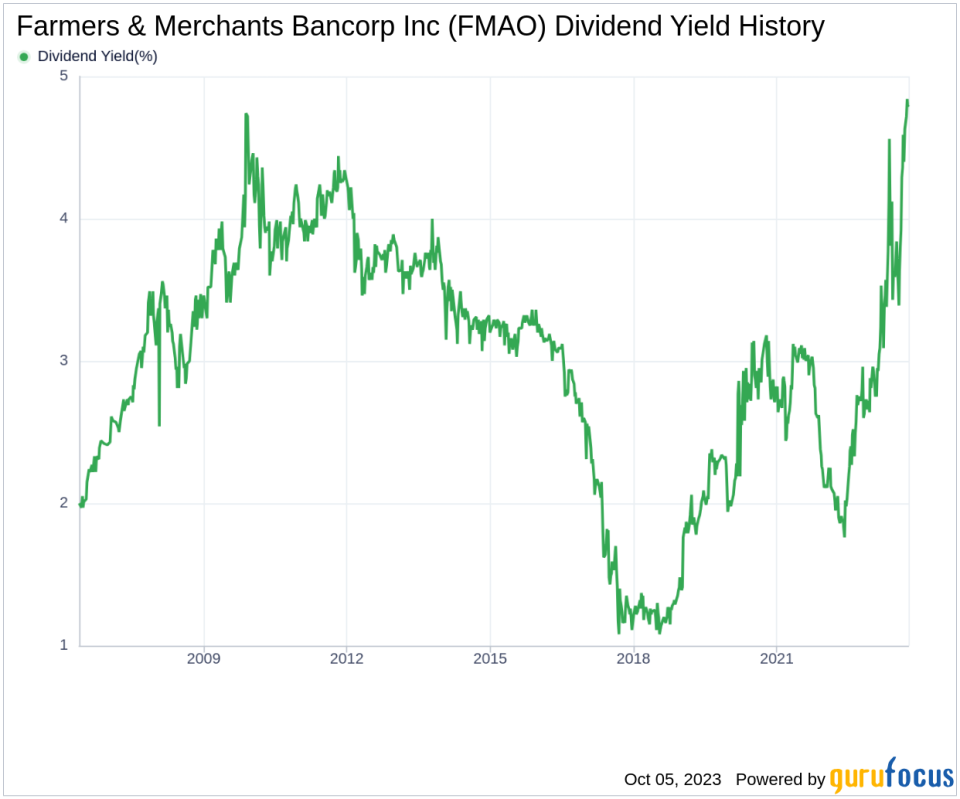
As of today, Farmers & Merchants Bancorp Inc currently has a 12-month trailing dividend yield of 4.81% and a 12-month forward dividend yield of 4.81%. This suggests an expectation of same dividend payments over the next 12 months.
Over the past three years, Farmers & Merchants Bancorp Inc's annual dividend growth rate was 9.50%. Extended to a five-year horizon, this rate decreased to 9.40% per year. And over the past decade, Farmers & Merchants Bancorp Inc's annual dividends per share growth rate stands at 7.60%.
Based on Farmers & Merchants Bancorp Inc's dividend yield and five-year growth rate, the 5-year yield on cost of Farmers & Merchants Bancorp Inc stock as of today is approximately 7.54%.
Assessing Dividend Sustainability: Payout Ratio and Profitability
To assess the sustainability of the dividend, one needs to evaluate the company's payout ratio. The dividend payout ratio provides insights into the portion of earnings the company distributes as dividends. A lower ratio suggests that the company retains a significant part of its earnings, thereby ensuring the availability of funds for future growth and unexpected downturns. As of 2023-06-30, Farmers & Merchants Bancorp Inc's dividend payout ratio is 0.39.
Farmers & Merchants Bancorp Inc's profitability rank, offers an understanding of the company's earnings prowess relative to its peers. GuruFocus ranks Farmers & Merchants Bancorp Inc's profitability 6 out of 10 as of 2023-06-30, suggesting fair profitability. The company has reported positive net income for each of year over the past decade, further solidifying its high profitability.
Looking Ahead: Growth Metrics
To ensure the sustainability of dividends, a company must have robust growth metrics. Farmers & Merchants Bancorp Inc's growth rank of 6 out of 10 suggests that the company has a fair growth outlook.
Revenue is the lifeblood of any company, and Farmers & Merchants Bancorp Inc's revenue per share, combined with the 3-year revenue growth rate, indicates a strong revenue model. Farmers & Merchants Bancorp Inc's revenue has increased by approximately 9.90% per year on average, a rate that outperforms than approximately 68.36% of global competitors.
The company's 3-year EPS growth rate showcases its capability to grow its earnings, a critical component for sustaining dividends in the long run. During the past three years, Farmers & Merchants Bancorp Inc's earnings increased by approximately 14.00% per year on average, a rate that outperforms than approximately 64.94% of global competitors.
Lastly, the company's 5-year EBITDA growth rate of 11.00%, which outperforms than approximately 58.41% of global competitors.
Concluding Thoughts
With a consistent dividend payment record, a fair dividend yield, and robust growth metrics, Farmers & Merchants Bancorp Inc presents a compelling case for investors seeking stable income. However, like any investment, it's crucial to evaluate the company's overall financial health, market position, and future growth prospects. As the company continues to navigate the financial landscape, investors should keep an eye on any changes that might impact its ability to maintain and grow its dividends.
GuruFocus Premium users can screen for high-dividend yield stocks using the High Dividend Yield Screener.
This article first appeared on GuruFocus.
