Unveiling Elastic NV (ESTC)'s Value: Is It Really Priced Right? A Comprehensive Guide
With a daily gain of 2.02%, a 3-month gain of 20.43%, and a Loss Per Share of 2.24, the question arises: Is Elastic NV (NYSE:ESTC) significantly undervalued? This article aims to answer that question through an in-depth valuation analysis. The following sections will provide a comprehensive understanding of Elastic NV (NYSE:ESTC)'s financial standing, intrinsic value, and future prospects. Let's delve into the details.
Company Introduction
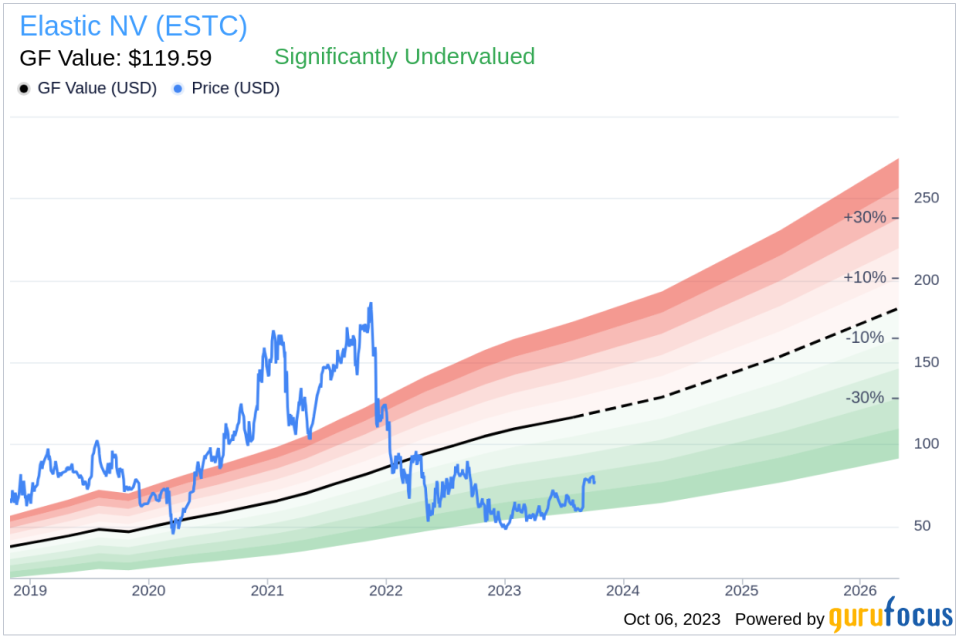
Elastic NV, a software company based in Mountain View, California, specializes in search-adjacent products. Its search engine processes both structured and unstructured data, providing insights from the data. The company's primary focus is on enterprise search, observability, and security. With a stock price of $77.67 and a GF Value of $119.59, Elastic NV (NYSE:ESTC) appears to be significantly undervalued. However, a deeper exploration of the company's value is needed, which integrates financial assessment with essential company details.
Understanding the GF Value
The GF Value is a unique measure of a stock's intrinsic value. It's calculated based on historical trading multiples, a GuruFocus adjustment factor based on past performance and growth, and future business performance estimates. The GF Value Line on our summary page provides an overview of the fair value that the stock should be traded at.
Elastic NV (NYSE:ESTC)'s stock is estimated to be significantly undervalued based on the GuruFocus Value calculation. The current price of $77.67 per share gives Elastic NV a market cap of $7.60 billion, suggesting that the stock is significantly undervalued. As a result, the long-term return of its stock is likely to be much higher than its business growth.
Link: These companies may deliver higher future returns at reduced risk.
Financial Strength
Checking the financial strength of a company before buying its stock is critical. Investing in companies with poor financial strength carries a higher risk of permanent loss. The cash-to-debt ratio and interest coverage are great indicators of a company's financial strength. Elastic NV has a cash-to-debt ratio of 1.62, which is worse than 58% of 2726 companies in the Software industry. The overall financial strength of Elastic NV is 5 out of 10, which indicates fair financial strength.

Profitability and Growth
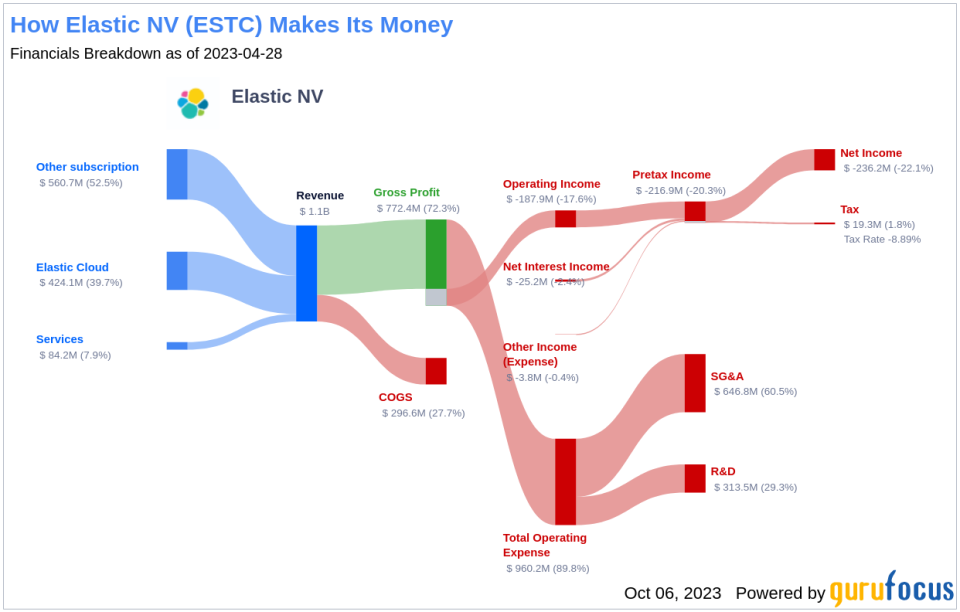
Investing in profitable companies, especially those with consistent profitability over the long term, is less risky. Elastic NV has been profitable 0 over the past 10 years. Over the past twelve months, the company had a revenue of $1.10 billion and a Loss Per Share of $2.24. Its operating margin is -14.63%, which ranks worse than 71.15% of 2759 companies in the Software industry. Overall, the profitability of Elastic NV is ranked 3 out of 10, indicating poor profitability.
Growth is probably the most important factor in the valuation of a company. The 3-year average annual revenue growth rate of Elastic NV is 27.2%, which ranks better than 82.75% of 2400 companies in the Software industry. The 3-year average EBITDA growth rate is 3.3%, which ranks worse than 60.38% of 1989 companies in the Software industry.
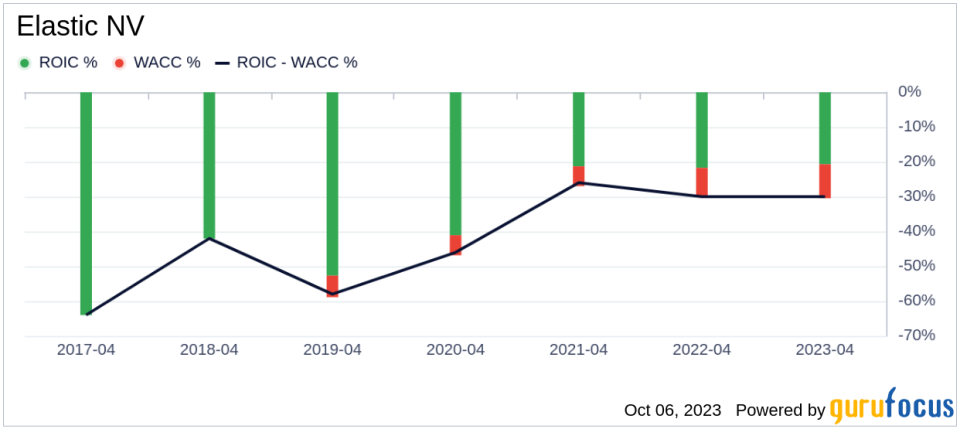
Another way to evaluate a company's profitability is to compare its return on invested capital (ROIC) to its weighted cost of capital (WACC). Return on invested capital (ROIC) measures how well a company generates cash flow relative to the capital it has invested in its business. The weighted average cost of capital (WACC) is the rate that a company is expected to pay on average to all its security holders to finance its assets. If the ROIC is higher than the WACC, it indicates that the company is creating value for shareholders. Over the past 12 months, Elastic NV's ROIC was -19.57, while its WACC came in at 8.5.
Conclusion
In conclusion, the stock of Elastic NV (NYSE:ESTC) is estimated to be significantly undervalued. The company's financial condition is fair, and its profitability is poor. Its growth ranks worse than 60.38% of 1989 companies in the Software industry. To learn more about Elastic NV stock, you can check out its 30-Year Financials here.
To find out the high quality companies that may deliver above average returns, please check out GuruFocus High Quality Low Capex Screener.
This article, generated by GuruFocus, is designed to provide general insights and is not tailored financial advice. Our commentary is rooted in historical data and analyst projections, utilizing an impartial methodology, and is not intended to serve as specific investment guidance. It does not formulate a recommendation to purchase or divest any stock and does not consider individual investment objectives or financial circumstances. Our objective is to deliver long-term, fundamental data-driven analysis. Be aware that our analysis might not incorporate the most recent, price-sensitive company announcements or qualitative information. GuruFocus holds no position in the stocks mentioned herein.
This article first appeared on GuruFocus.
